AI-Powered Visual Tracking Plan Creation from Figma Designs
Turn Figma designs into tracking plans with AI event suggestions linked directly to design components. Create visual tracking documentation that shows developers exactly what to implement, eliminating bugs and cutting implementation time by 50%. Perfect for product teams using Amplitude, Mixpanel, Posthog and other analytics tools who want to improve cross-team alignment and stop releasing features without tracking.
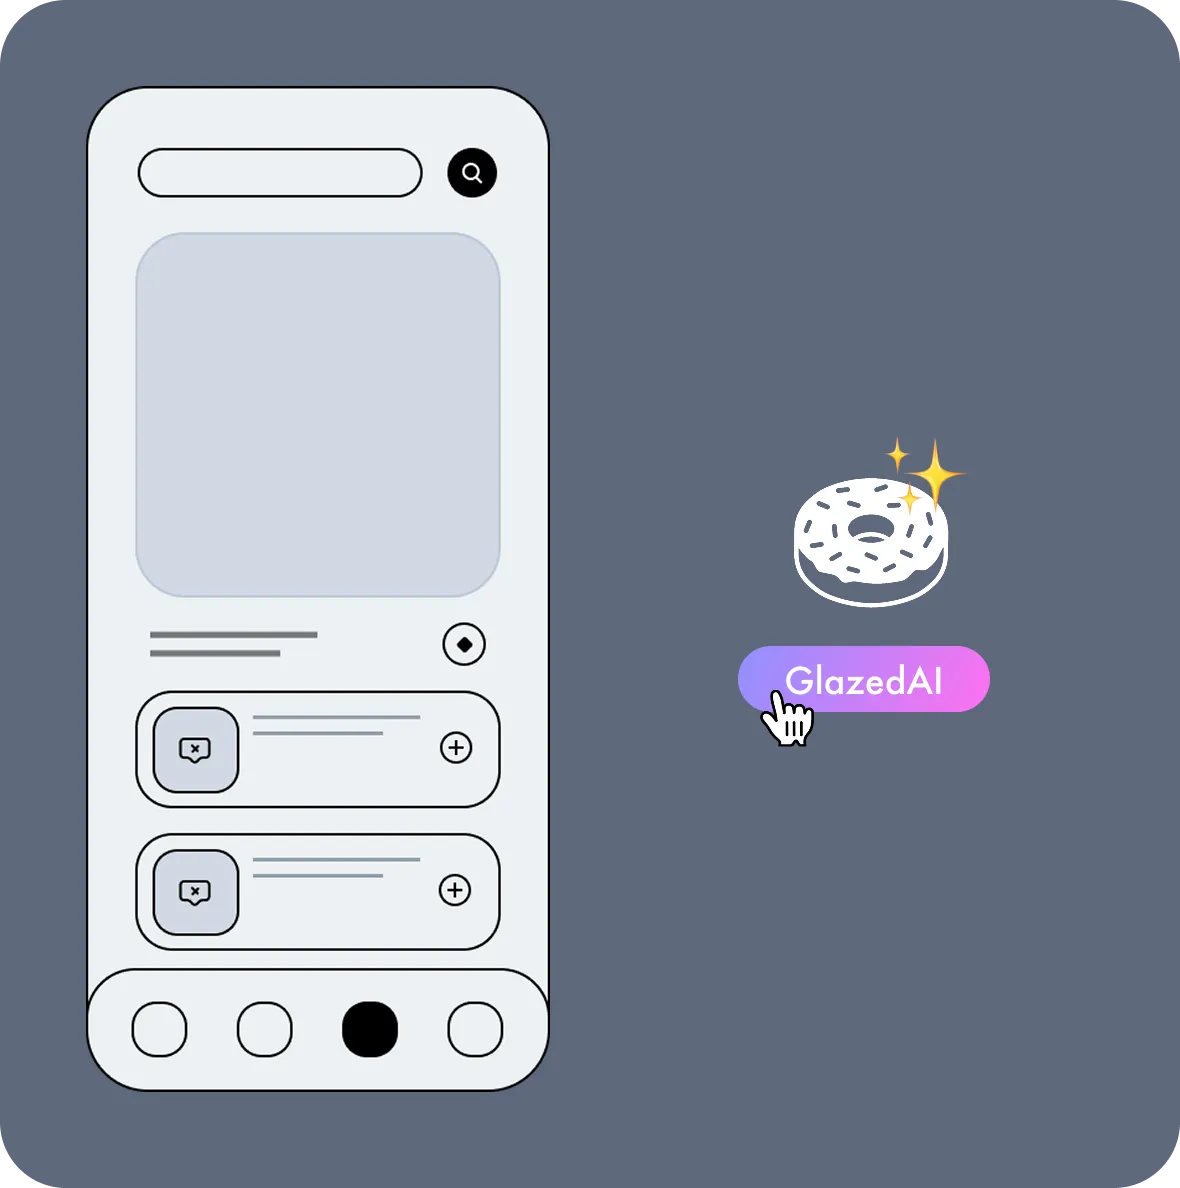
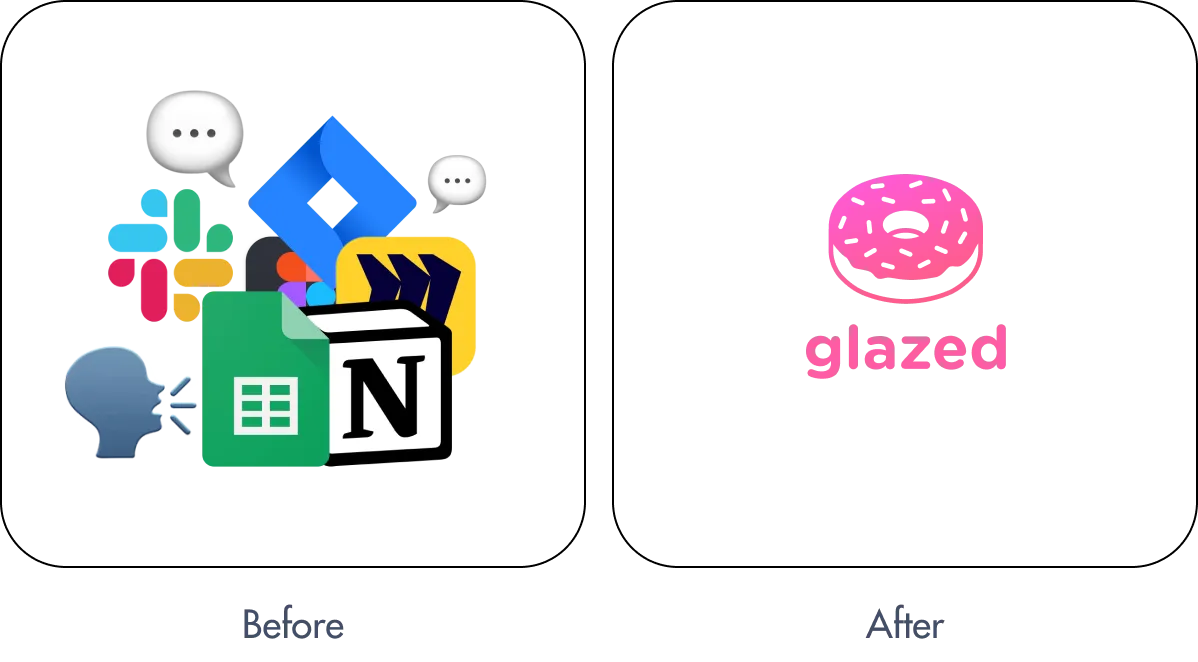
Turn Figma Designs into Tracking Plans
Create and link events to design components with AI.
Your tracking plan ready for handoff
in minutes, not days.
Trusted by teams at
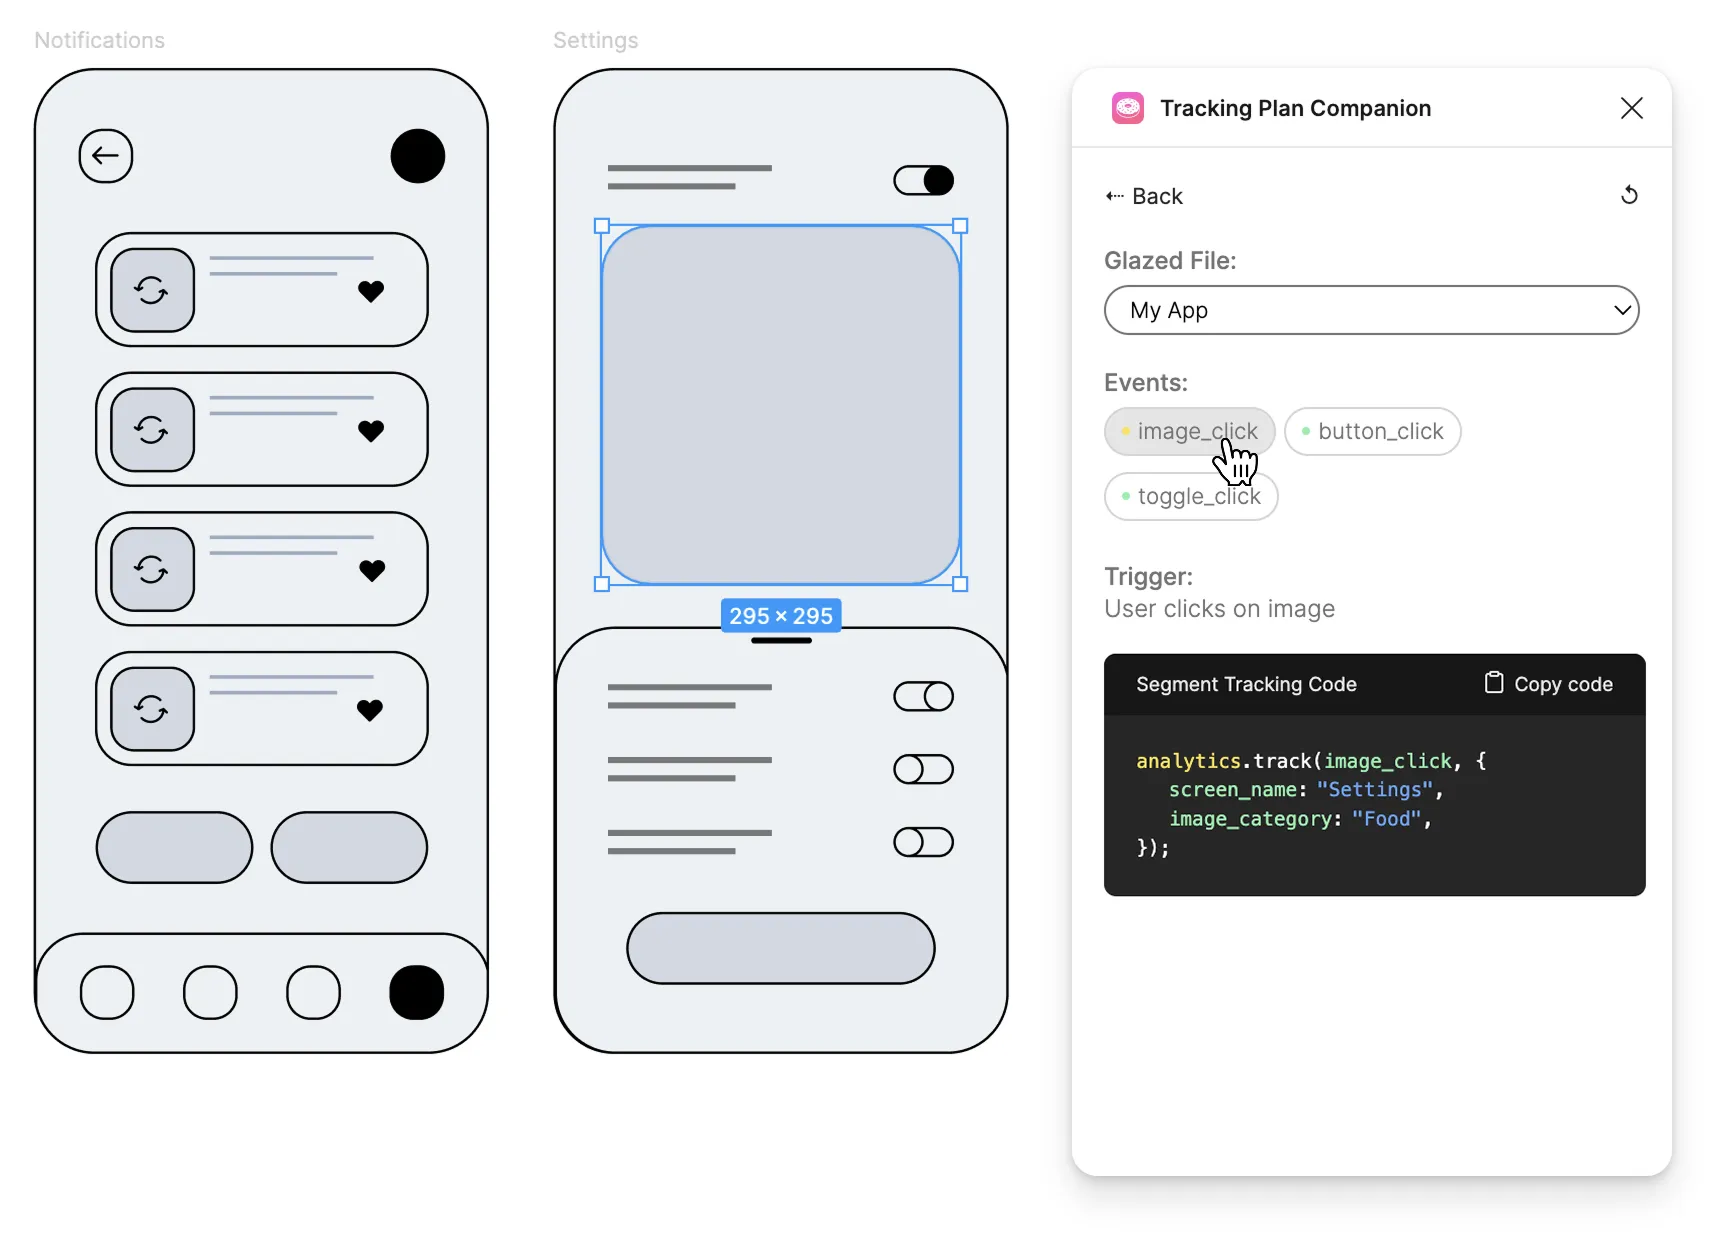
Create and link events with AI:
1. Select a Figma screen that needs tracking
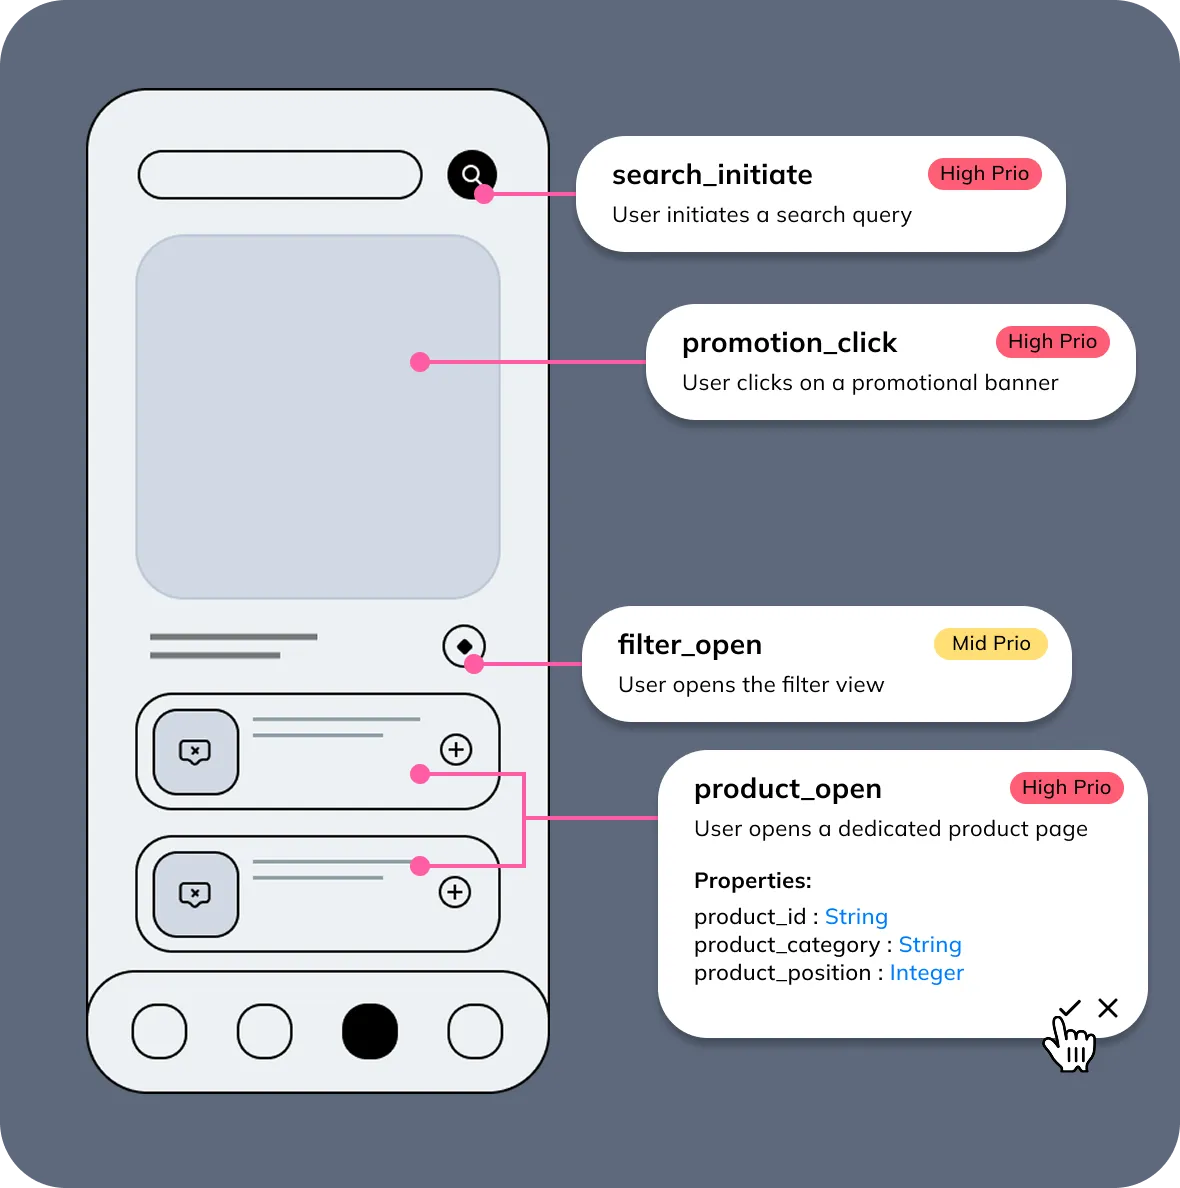
2. Review suggested events and confirm
AI Event Discovery and Tracking Plan Automation
AI analyzes Figma designs and existing event taxonomy to suggest relevant tracking events 60x faster than manual creation. Automatically generate tracking plans with approve, edit, and reject controls. Perfect for product and analytics teams who spend days manually creating events - now done in minutes with intelligent event suggestions that match your existing analytics setup in Amplitude, Mixpanel, Posthog or other analytics platforms.
AI-Powered
Event Creation
AI-Powered
Event Creation
GlazedAI analyses your Figma design, learns your existing events and taxonomy and suggests relevant events with full approve/edit/reject control.
60x faster tracking plan creation
- AI-powered event suggestions from Figma designs
- Intelligent tracking plan generation
- Figma design and tracking plan analysis
- 60x faster event creation
- Automated taxonomy learning
- No tracking spreadsheet dependency
Visual Event Discovery and Analytics Self-Service
Enable true data democratization with visual event discovery that's 10x easier than spreadsheets. Stop "what's that event?" Slack messages with intuitive visual browsing that lets anyone instantly find events, understand what triggers them, and see how to use them. Perfect for teams wanting self-service analytics where product managers, designers, and analysts can discover events without bothering the data team. Visual beats spreadsheets for event discovery every time.
Your Tracking
Plan in Context
Your Tracking
Plan in Context
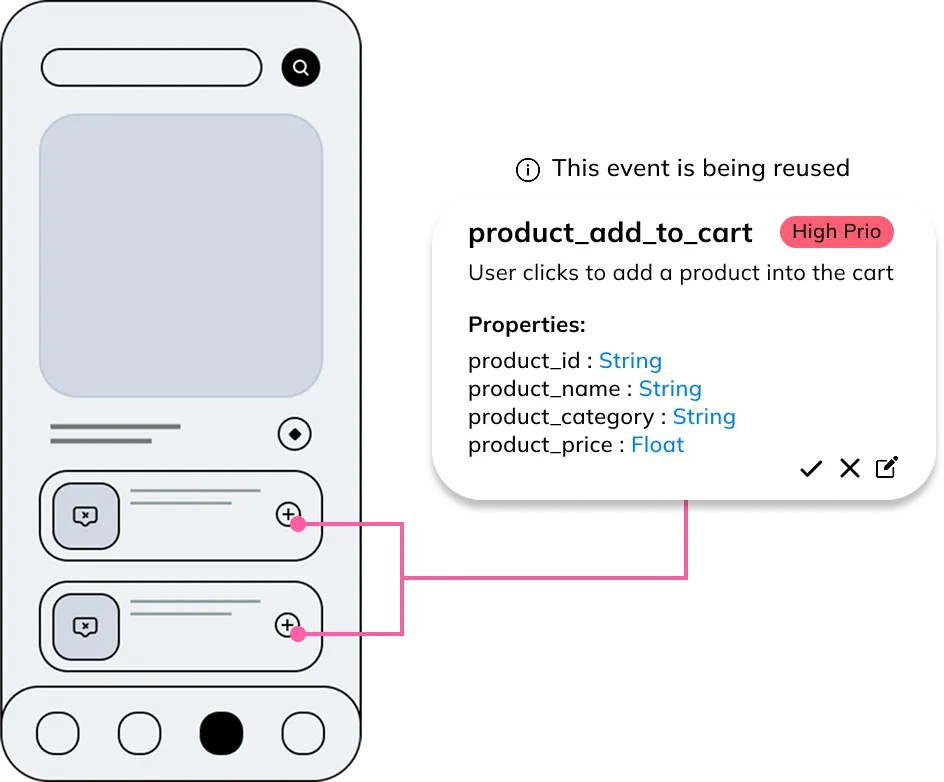
Create events visually from Figma designs and let anyone understand what's tracked. Unlock event discoverability and analytics self-service.
An image is worth 1,000 rows
- Visual event browsing on Figma design files
- Instant visual event discovery
- Self-service analytics enablement in Figma
- 10x easier than spreadsheets
- Data democratization
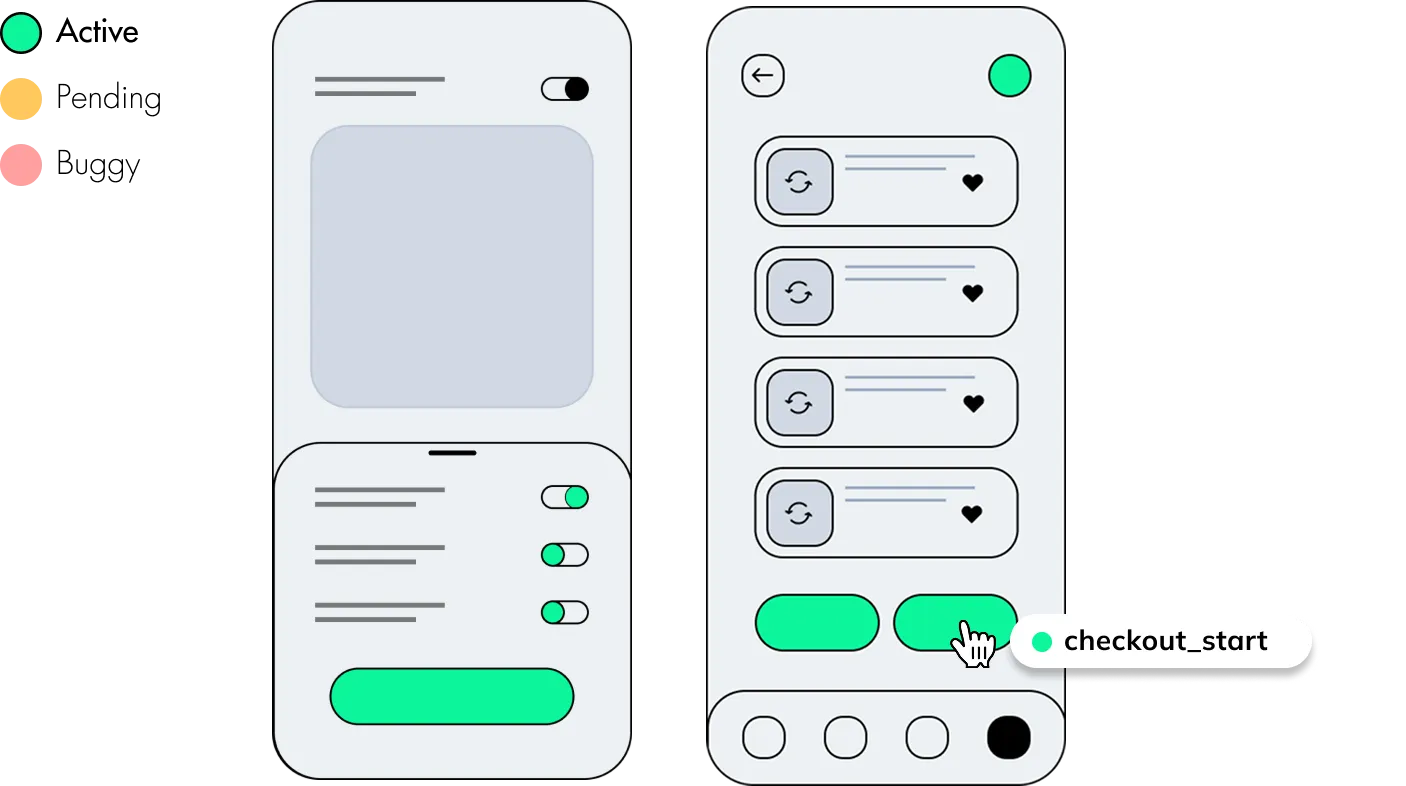
- Event status visualization
- Stop tracking-related Slack pings
Replace Tracking Spreadsheets with Visual Team Collaboration
Eliminate scattered Confluence and Notion docs, tracking spreadsheets, and endless alignment meetings with unified visual tracking documentation. Create a single source of truth that keeps product, design, engineering, and data teams synchronized throughout the development cycle. Stop tracking coordination chaos with one platform that replaces multiple tools and reduces cross-team meetings by 80%. Perfect for teams tired of duplicate events, outdated spreadsheets, and a lack of clear process and analytics documentation.
Ditch Your
Spreadsheets
Ditch Your
Spreadsheets
Replace scattered Notion docs, tracking spreadsheets and endless alignment meetings with one visual system that keeps product, design, engineering, and data teams in sync.
A single source-of-truth for all teams
- Replace tracking spreadsheets
- Eliminate Confluence documentation chaos
- Cross-team tracking alignment and collaboration
- 80% fewer alignment meetings
- Visual tracking documentation
- Product-design-engineering sync
- Single source of truth
- Stop manual tracking docs maintenance
Analytics Event Tracking Plugin for Figma
Generate perfect tracking implementation specs directly in Figma with exact element IDs, event names, and property definitions. Eliminate developer confusion and interpretation errors with visual tracking handoffs that show exactly which UI components trigger events. Reduce implementation bugs by 95% and cut alignment meetings by 80% with clear, visual specifications that developers can implement immediately.
Handover Events,
Not Headaches
Handover Events,
Not Headaches
Handover detailed specs in our Figma plugin and minimise interpretation errors. Developers see exact triggers, event names and custom property values.
80% fewer tracking alignment meetings
- Developer implementation specs
- Visual tracking handoff in Figma
- Exact element ID trigger action identification
- 90% fewer implementation bugs
- Cross-team alignment tools for tracking and analytics
- Native Figma integration
- Eliminate interpretation errors
- Perfect tracking specifications
Fast Setup Integration with Figma and Analytics Tools
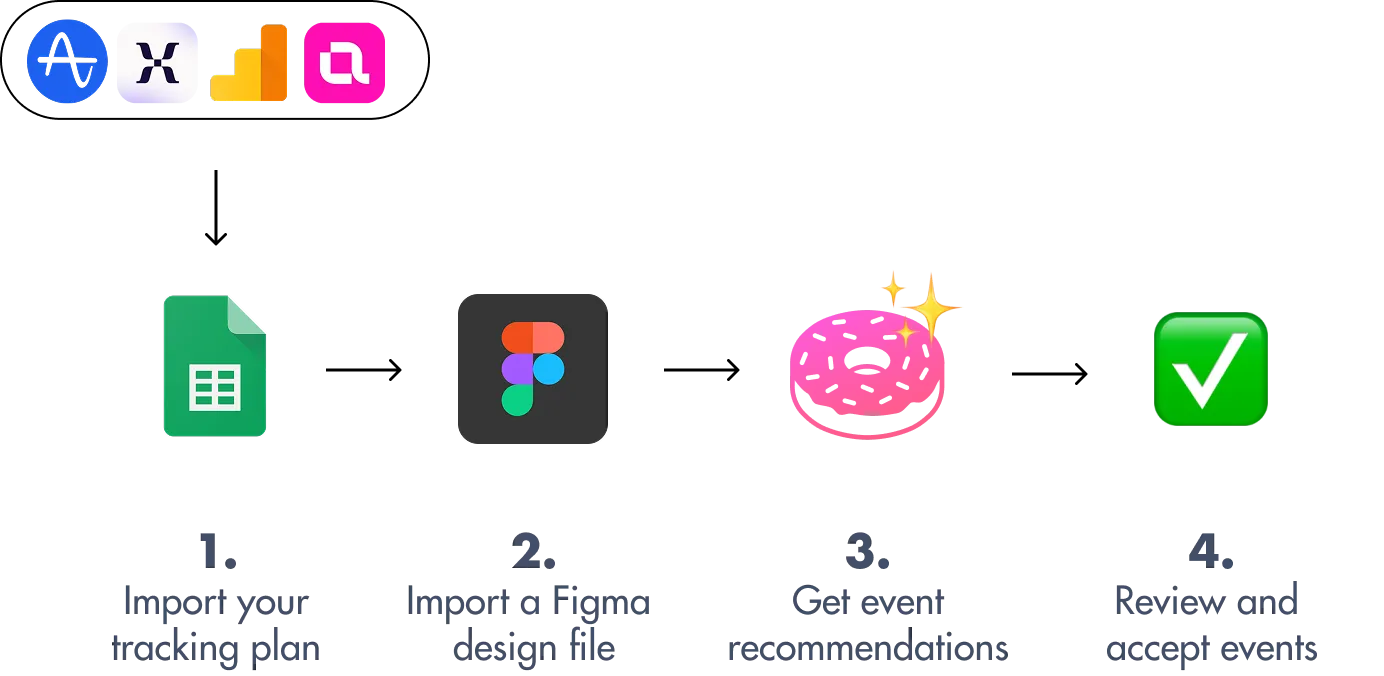
Get started with visual tracking plan creation in under 10 minutes. Import your tracking plan, connect Figma files, and start creating tracking plans with AI recommendations. No complex setup, no engineering sprints, no workflow disruption. Perfect for teams using Amplitude, Mixpanel, Posthog or other analytics platforms who want to eliminate setup friction and start improving their tracking process immediately. Simple 4-step process gets you from zero to tracking plan creation instantly.
Ready in Minutes,
Not Months
Ready in Minutes,
Not Months
Import your tracking plan, connect a Figma file and start creating tracking plans. No complex setup, no engineering sprints, no workflow disruption.
Start creating tracking plans in <10 minutes
- 10-minute setup process
- Import existing tracking plans
- Connect Figma design files
- AI event recommendations
- No engineering required
- Zero workflow disruption
- Amplitude integration
- Mixpanel integration
- Simple 4-step process
- Instant tracking plan creation
Real-time Tracking QA and Event Monitoring
Prevent tracking failures before they impact your analytics with real-time event monitoring and validation. Identify when events break, go missing, or behave unexpectedly across your entire product. Never ship features without tracking again - monitor tracking health continuously and catch issues before they reach production. Reduce tracking implementation bugs by 90% with proactive monitoring that prevents broken dashboards and missing analytics data.
Never Ship
Blind Again
Never Ship
Blind Again
Monitor tracking health in real-time across your entire product. Get alerted when events break, go missing, or behave unexpectedly.
90% fewer tracking implementation bugs
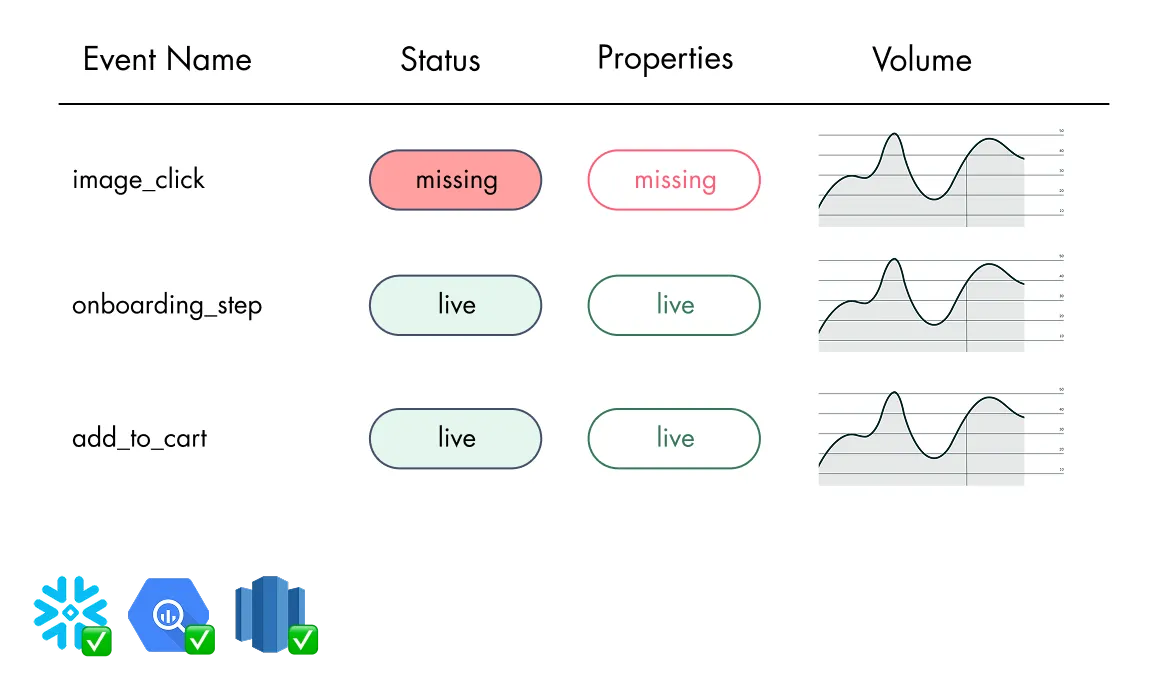
- Real-time event status monitoring
- Missing event detection
- Tracking health validation
- 90% fewer implementation bugs
- Production tracking monitoring
- Automate analytics tracking QA testing
- Prevent broken analytics dashboards
Glazed Analytics Pricing Plans
Flexible pricing options for teams of all sizes. From small product teams to enterprise-scale analytics implementations.
🍰 Starter
For small teams
building a simple product
Basic
- 14-day Free Trial
- ✓ 5 editor seats
- ✓ 20 viewers
- ✓ 15 design files
- ✓ 1 project
- ✓ 30 days history
- ✓ Figma plugin
Basic
- 14-day Free Trial
- ✓ 5 editor seats
- ✓ 20 viewers
- ✓ 15 design files
- ✓ 1 project
- ✓ 30 days history
- ✓ Figma plugin
🎂 Growth
For collaboration across
multiple teams and products
Custom
- ✓ Unlimited seats
- ✓ Unlimited design files
- ✓ Unlimited projects
- ✓ Real-time QA
- ✓ 1 year history
- ✓ Figma plugin
- ✓ Dedicated support hours
Custom
- ✓ Unlimited seats
- ✓ Unlimited design files
- ✓ Unlimited projects
- ✓ Real-time QA
- ✓ 1 year history
- ✓ Figma plugin
- ✓ Dedicated support hours
Available Features
- Figma plugin integration
- Design file tracking
- Historical data access
- Multi-user collaboration
- Dedicated support
- Analytics implementation
Our Vision for Analytics and Data-Driven Teams
Empowering teams with intuitive analytics tools for better decision making and user experiences. Building the future of data-informed product development.
Invest today in
tomorrow's data
Our mission is to empower cross-functional teams to collect that right data, optimise user experiences and drive business results.
We believe in a company culture where data-informed decisions are the norm rather than the exception.
Our Vision:
Core Values and Principles
- Zero-learning curve analytics
- Data-driven decision making
- Cross-functional team empowerment
- Visual analytics implementation
- Automated tracking solutions
- User experience optimization
- Team collaboration focus
- Seamless integration capabilities