Unlock analytics self-service and start validating your designs today
- ✅ 10x faster time to insights via analytics self-service
- ✅ Validate the impact of your designs from day 1
- ✅ Understand what events are tagged and request new tags
- ✅ Iterate faster by shortening time to release and value
- ✅ Reduce back and forth communication and friction
- ✅ Support user empathy and a stronger design culture
☞ Create User Funnels Visually
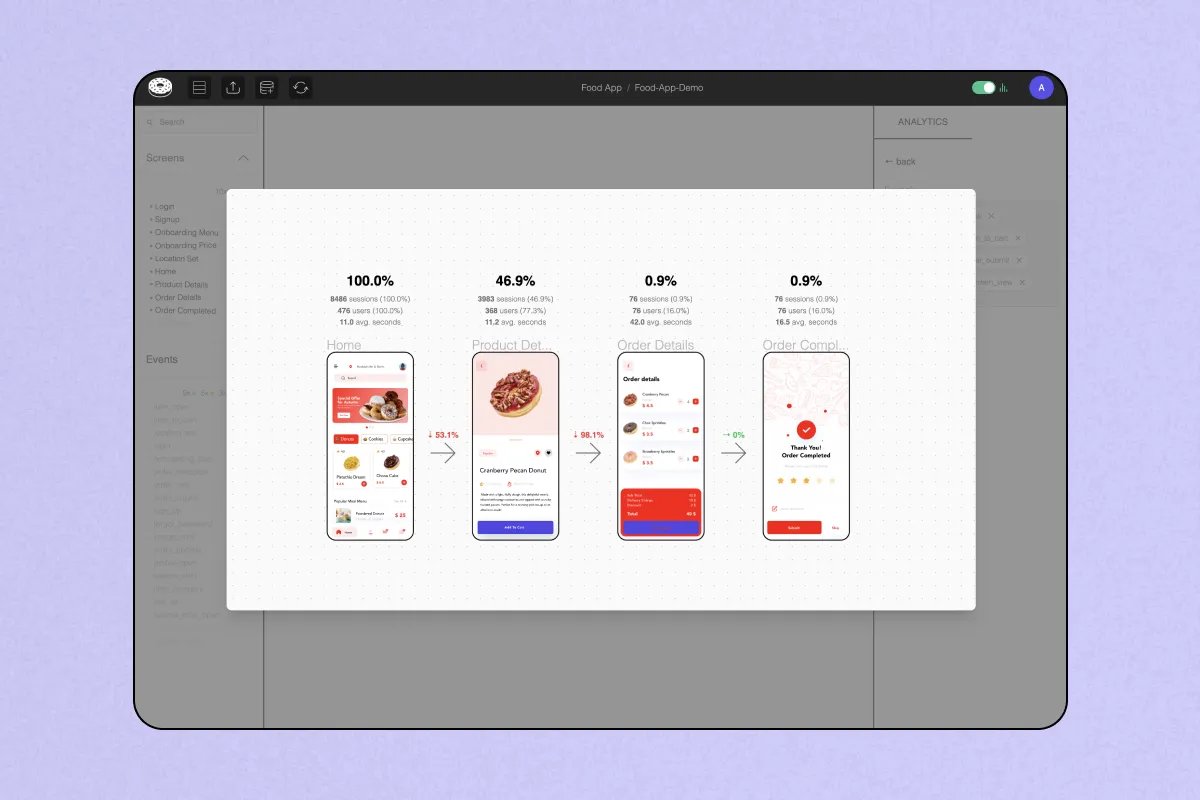
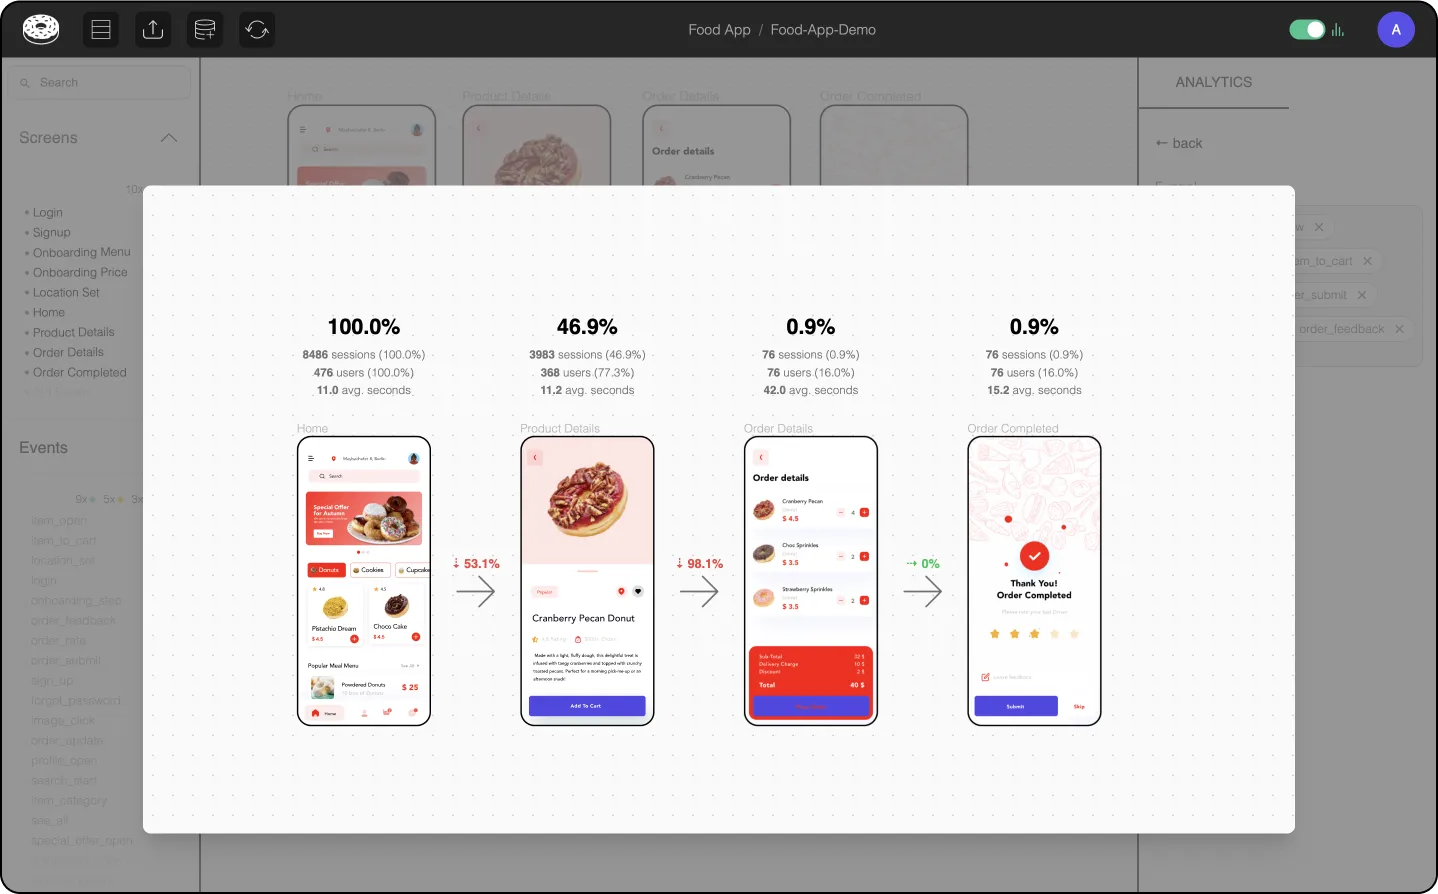
Identifying conversion rates and identifying where your drop-offs take place has never been easier. With Glazed you can build your own funnels intuitively by clicking on screens and/or elements of your UI. Forget about having to find the right event names to create your own funnels.
Step 1: Click on screens and/or elements to build the funnel
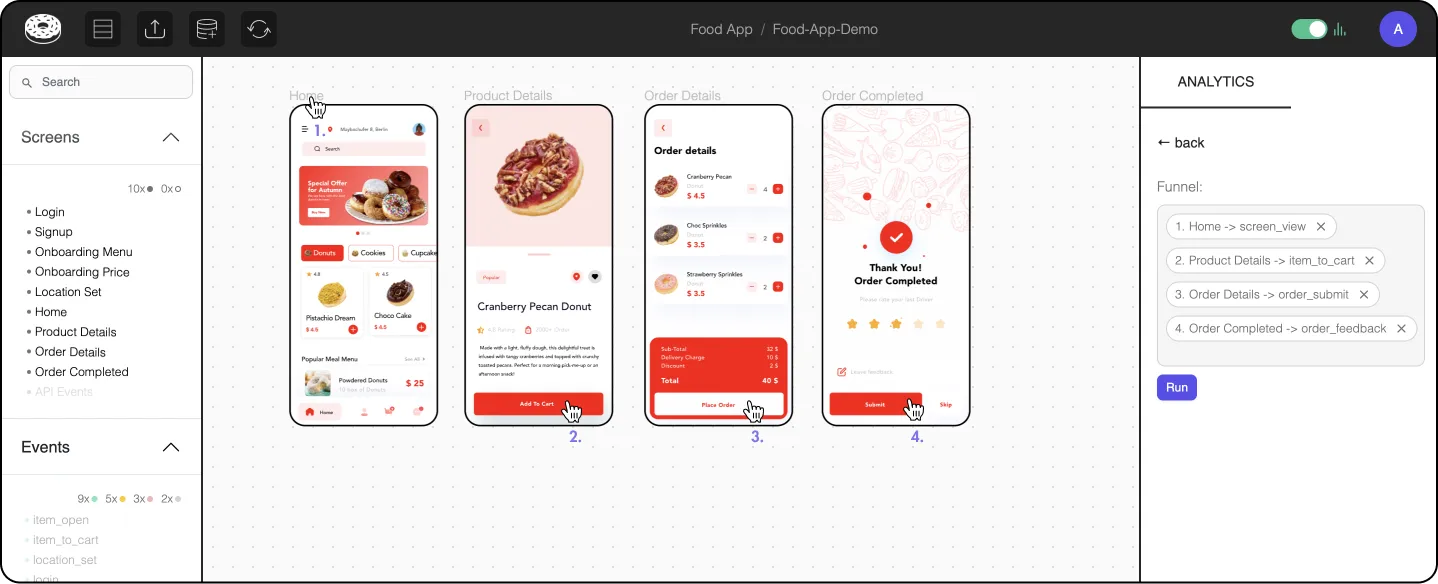
Step 2: Click ‘Run’ to see the funnel steps conversions
☞ Explore Event Data Intuitively
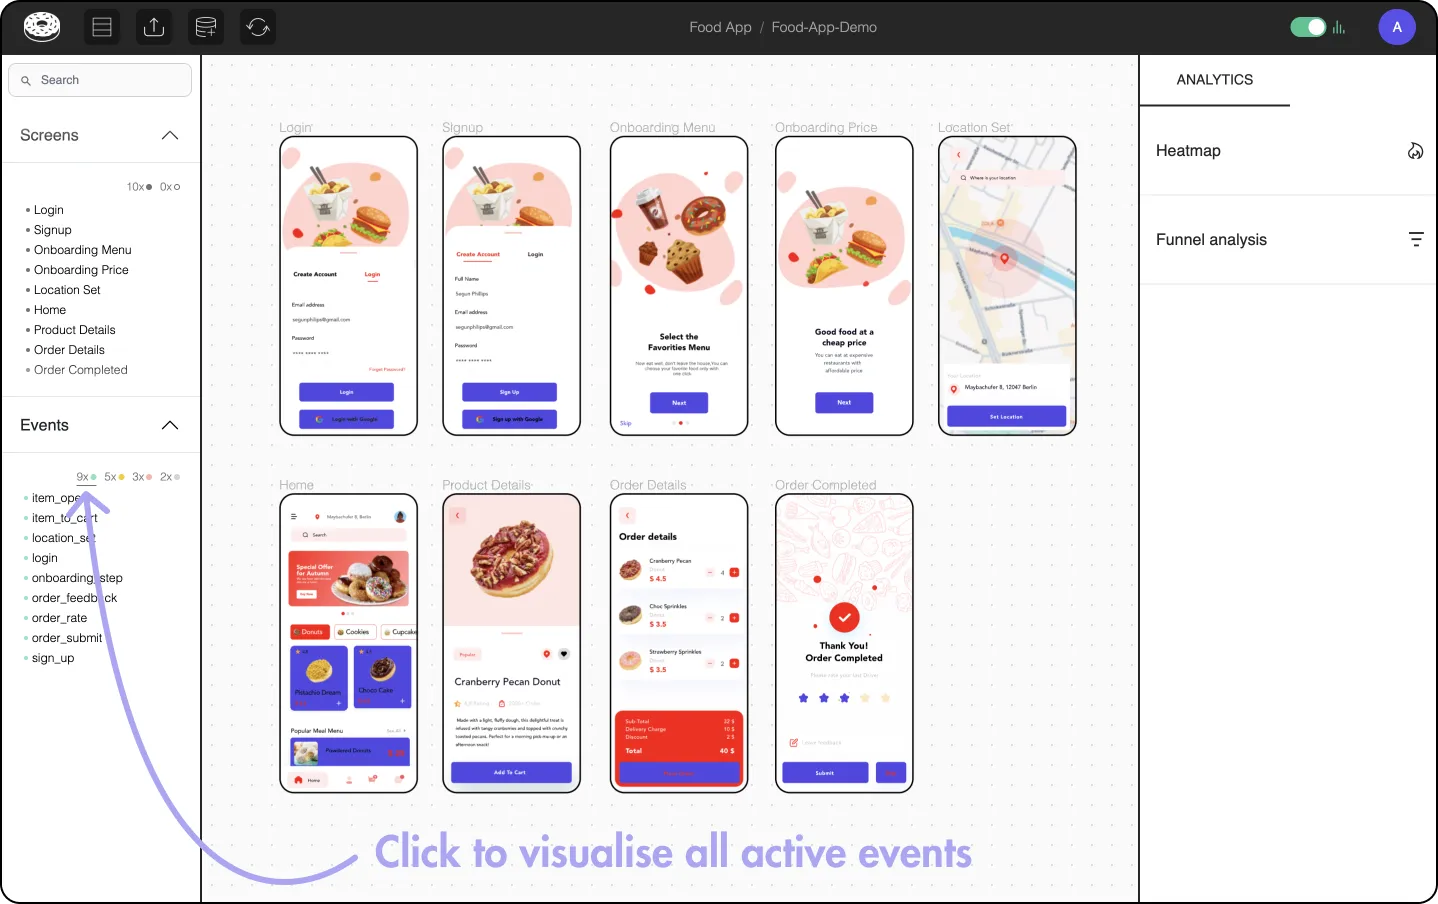
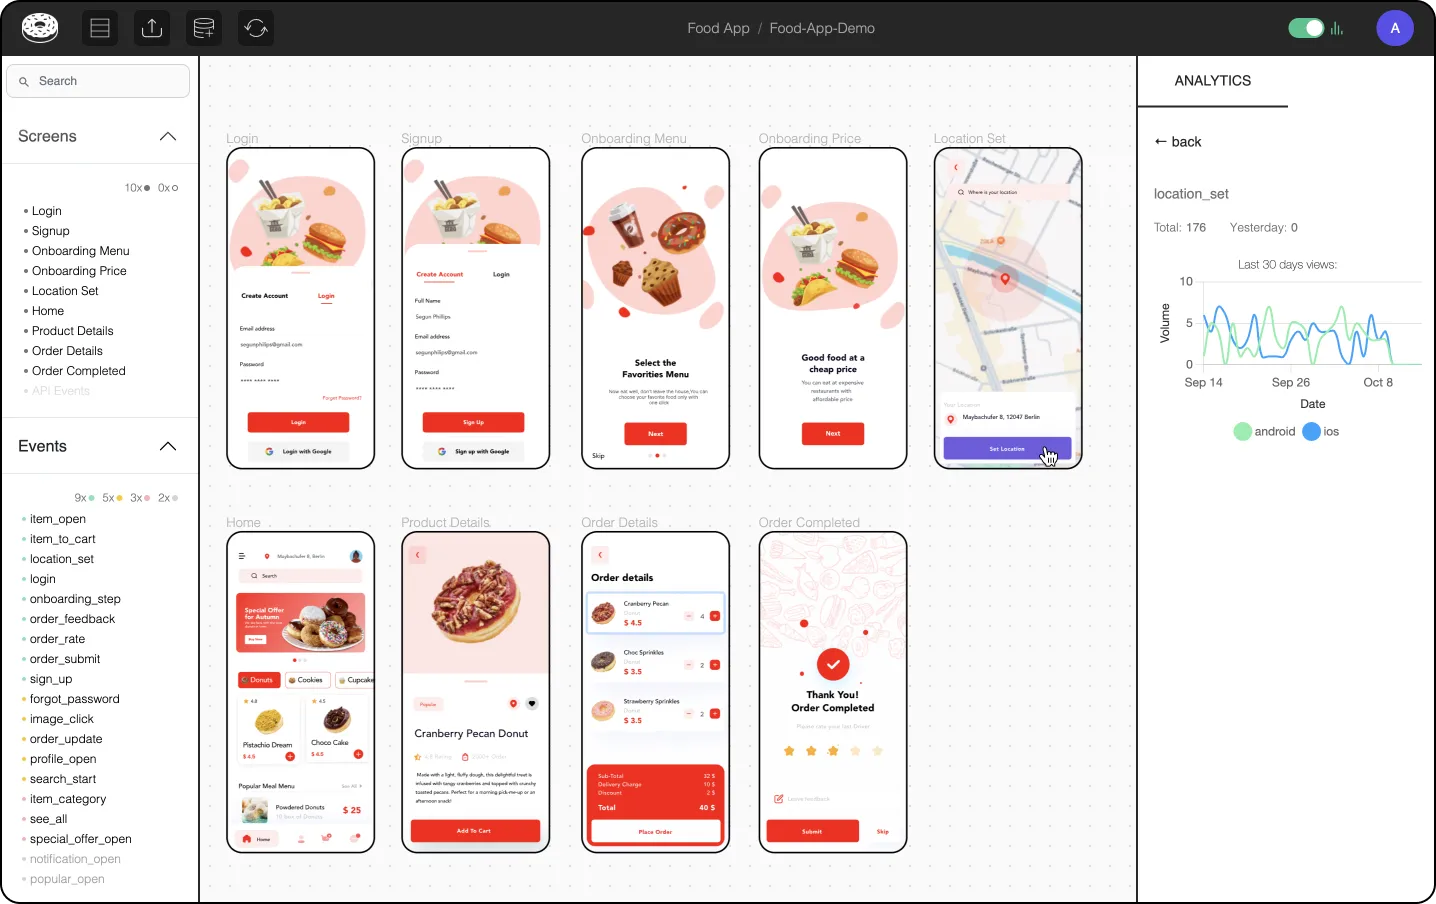
With Glazed anyone can find and understand events in seconds instead of days. No need to navigate complex tracking plans, run queries or ping someone on Slack, you can do it interactively from your product’s UI.
Step 1: Click ‘Active’ to preview all active events in the file
Step 2: Click a design element to access it’s usage
Note that we split usage by platform, to help you identify potential differences and unexpected behaviours that might occur across different platforms. More filters coming soon!
☞ See Click-Through Rates Across Screens
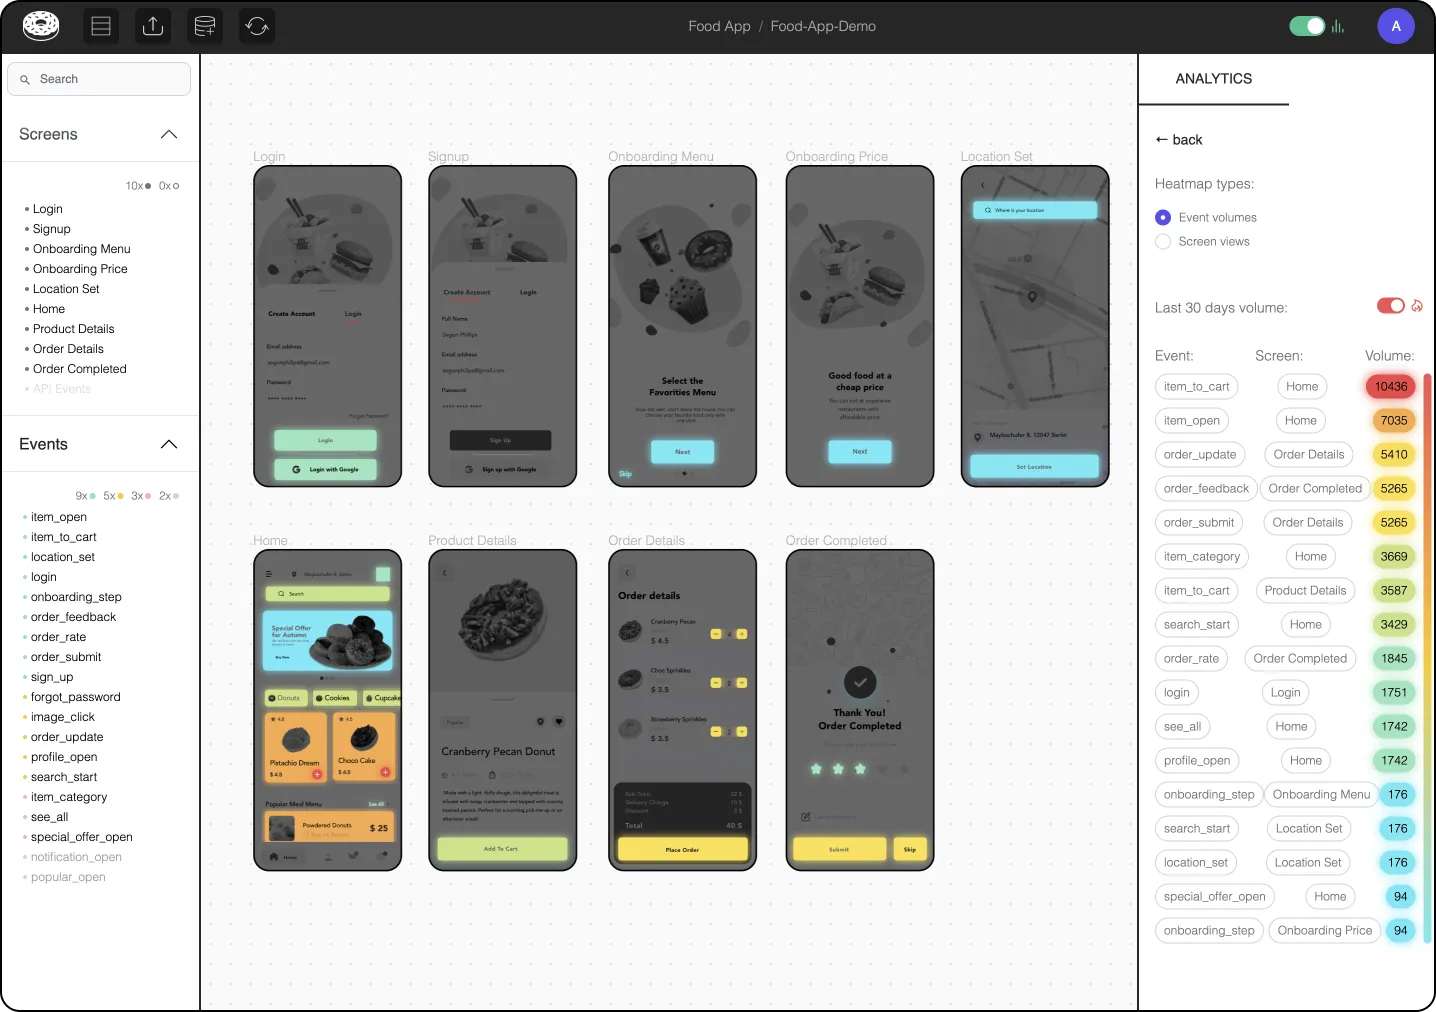
Understand at a glance how your designs perform on a file level (i.e. the overall feature) or on a screen level (what are the most/less used items in a given screen).
Step 1: Activate ‘Heatmaps’ to see click-through rates
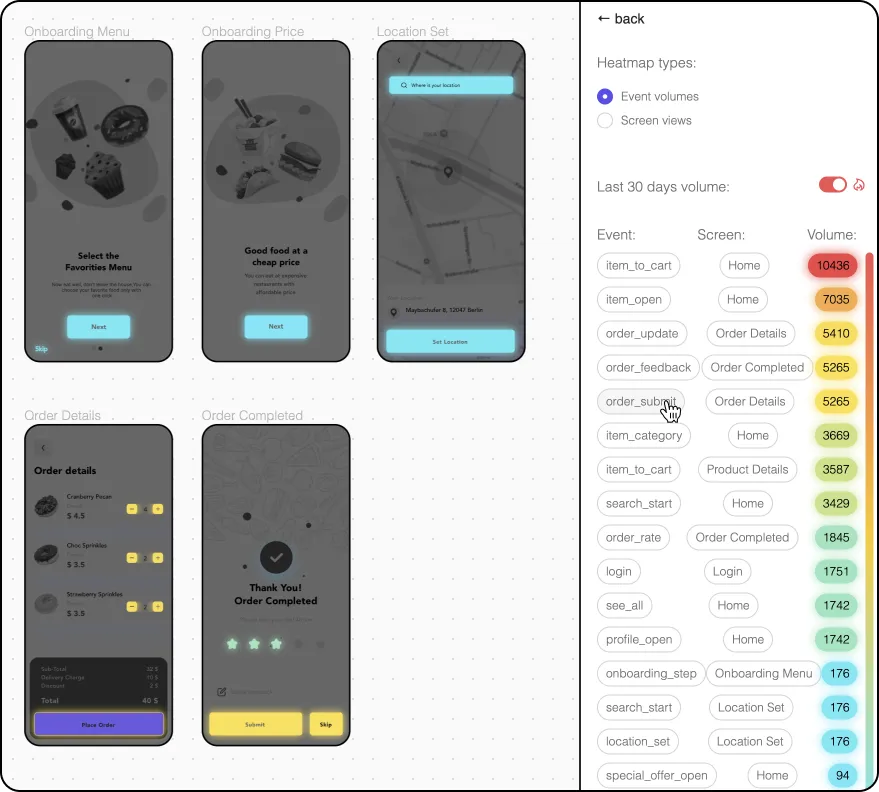
Step 2: hover over the event names to identify the corresponding element(s)
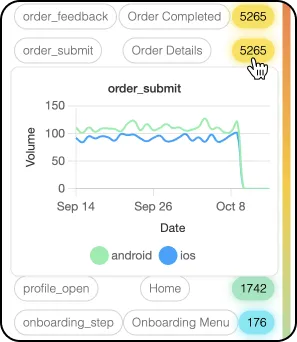
Step 3: hover over the ‘Volume’ to display the last 30-day usage
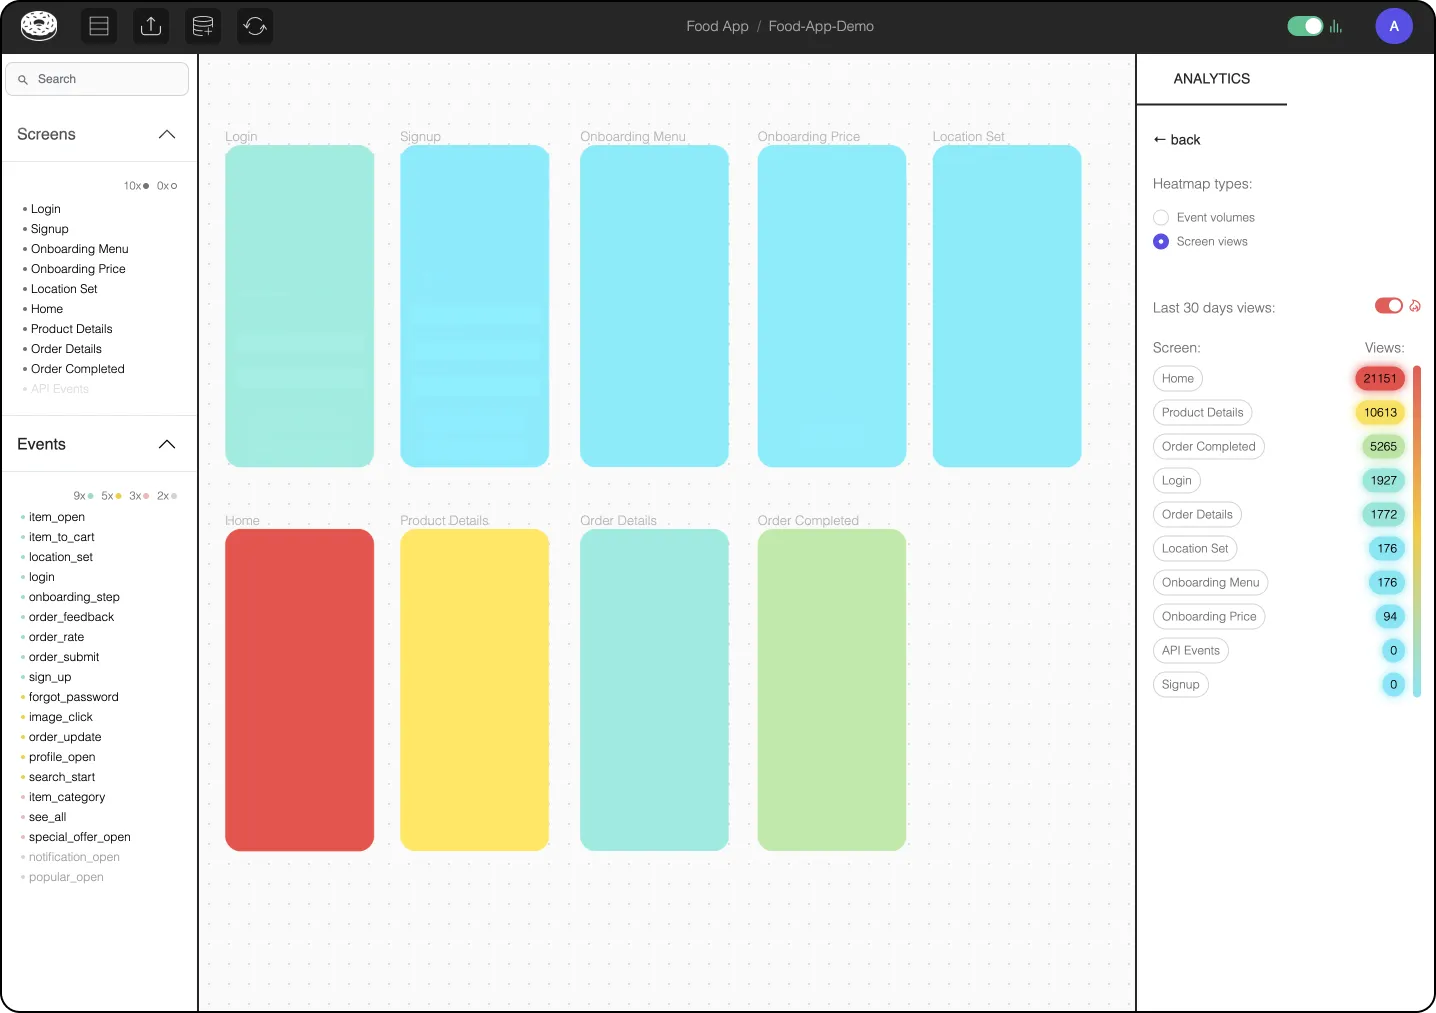
☞ Visualise Screen Views
Understand at a glance how your designs perform on a file level (i.e. the overall feature) or on a screen level (what are the most/less used items in a given screen).
🤗 Interested? Get in touch!
→ Join our Slack community
→ Drop us a email
