TL;DR
- Your tracking spreadsheets are costing you time and data quality
- Visual tracking in Figma cuts implementation time by 30-50% and reduces bugs by up to 90%
- Companies implementing this approach see 100% developer adoption
- Visual documentation in Figma improves data awareness and self-service, strengthening your company's data culture
The Challenges
Out of sight, out of mind
Your entire team already spends significant time in Figma discussing product and user flows, but your tracking plan is siloed in an overcrowded spreadsheet or doc. It's like keeping your most important cookbook in a hidden kitchen that nobody ever uses. As the saying goes, "out of sight, out of mind" – we've found this to be the main reason many teams leave tracking as an afterthought.
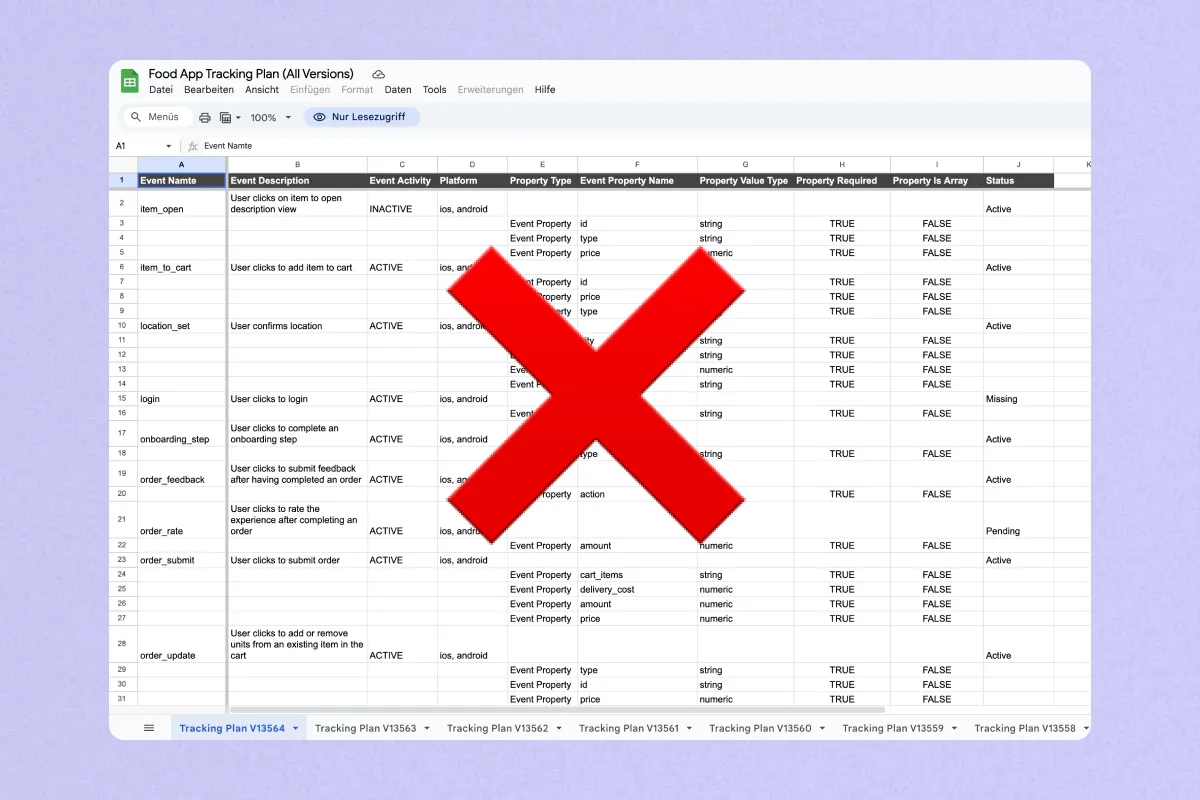
The 1,000-row tracking plan
Even if you have strong tracking advocates on your team, the user experience of a Notion table or Google Sheet is far from ideal, particularly when you have 500+ events. In our previous roles on data teams, we found that adding screenshots with arrows pointing to design elements helped clarify trigger actions for engineering and QA teams. However, this approach was time-consuming and difficult to maintain as designs evolved.
Duplicates, duplicates, duplicates
A common issue we've observed across many teams is the proliferation of duplicate events and properties in the codebase. This creates confusion when extracting insights and breeds distrust among stakeholders. Such duplication typically results from poor documentation and processes that force frontend engineers to create events without realizing they already exist in another part of the codebase.
The tracking spreadsheet graveyard
Unless you have a dedicated team with the (rather thankless) task of maintaining tracking documentation, the gap between your tracking spreadsheet and production reality will likely widen as the number of events grows, making maintenance increasingly difficult. Finding someone passionate about maintaining tracking spreadsheets on planet earth is rather rare – and chances are they're not on your team.
Onboarding new team members
One of the first things any experienced product lead will ask when joining a new team is about the user behavior data collected to gain a quantitative understanding of the product. Most teams will point them to high-level dashboards and their outdated tracking spreadsheet.
We've also seen teams thrown into chaos after the sole owner of the tracking process departed, leaving behind hard-to-decipher documents and tables. It can take months to make sense of all the events and create new documentation that others can reference in the future.
Back-and-forth discussions
Even with a well-documented tracking plan shared with the engineering team as part of your data contracts, you're likely spending unnecessary time in meetings and Slack conversations discussing tracking requirements, naming conventions, event triggers, and property values. Would you believe that 90% of those conversations could be avoided?
A Visual-First Solution
Context is Queen
The core principle is simple: it doesn't make sense to separate the process of defining and tracking user behavior from the interface where that behaviour actually takes place. Most of us think visually, and ample evidence shows that visual documentation is much easier to consume and less prone to errors than text-based documentation.
One workflow, fewer tools
Many developers waste time jumping between different tools (Jira → Google Sheets → Slack → Figma) trying to understand documentation and expected outcomes. By linking tracking requirements directly to design elements, you bring the conversation to one place, ensuring a single source of technical truth that everyone can align with.
Towards a better analytics self-service culture
Visual tracking documentation offers a valuable benefit: you create documentation that virtually anyone in your organization can use. Why? Because everyone is familiar with UIs. We've found that finding the right event name is the biggest blocker for analytics self-service – even technical people struggle to locate events in a well-documented tracking plan outside their team. The reason is simple: tracking taxonomy is often unintuitive. You can search for keywords, but strings will always be more abstract than screens. By contrast, how long would it take you to find a screen in a Figma design file? Seconds.
How Glazed Can Help
Some teams already successfully manage their tracking process in Figma using comments. However, as your team and product grow, you'll likely need a single source of truth with better governance to align multiple teams.
Here are a few highlights that make Glazed the most intuitive frontend tracking documentation and instrumentation tool in the market today:
A single repository for all tracking products
Glazed is structured in projects and files. One project represents one tracking plan shared across all design files within that project. This enables reuse of existing events and properties, avoiding duplicates and unnecessary work while maintaining a single source of truth.
![]()
High-level specification detail
With Glazed, you can specify expected property values for events on specific design elements. This is extremely helpful for developers, as they don't have to figure out what property values should be passed for a given event.
![]()
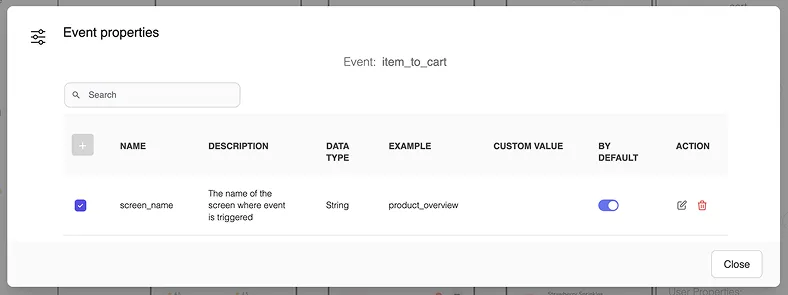
Default Event Properties
It's common to have a set of "default" properties passed with every event, sometimes called "super properties." With Glazed, you only need to create them once, set them to "By Default," and they'll be added to every new event you create, reducing manual effort.
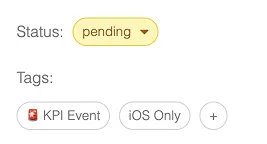
Custom Tags
Use searchable custom tags and status indicators to monitor implementation state and organize your events to suit your needs.
QA Monitoring
You can optionally connect to a database to monitor the arrival of events and their corresponding properties in real-time. Volume is split by platform, and properties are marked in red if missing.
![]()
Conclusion
The traditional approach to tracking plans—isolated in spreadsheets and disconnected from the design and development process—is not sustainable in the long term. By bringing tracking documentation directly into Figma, teams can:
- Cut alignment meetings by 80%
- Implement tracking 30-50% faster
- Reduce bugs by 50-90%
This isn't just about efficiency; it's about building a better data culture where tracking is integrated into your workflow from the start, not tacked on as an afterthought.
In a world where data-driven decisions are increasingly crucial to success, your tracking implementation shouldn't be a bottleneck. By making tracking plans visual and contextual, you empower every team member to contribute to better data collection, which ultimately leads to better insights and better products.
Ready to transform how your team approaches analytics tracking? Book a demo with one of our founders to learn more about how Glazed can support you and your team collect better data faster.