Visual Tracking Documentation Tool: Replace Tracking Spreadsheets with Figma-Linked Specs
Transform your tracking spreadsheet chaos into visual tracking documentation directly linked to Figma designs. Glazed is the tracking plan tool that eliminates alignment meetings, cuts implementation bugs by 50%, and saves product teams 50+ hours per sprint. Perfect for iOS, Android, and Web teams using Amplitude or Mixpanel who need cross-platform tracking consistency without developer coordination delays. Create visual tracking plans that developers actually understand—no more "which button?" confusion from markdown specs or Excel sheets.
Stop Wrestling with Tracking tables and Markdown Files
If your development team spends as much time decoding tracking specs as implementing them, you're not alone. Traditional tracking tables in Notion or Confluence, GitHub markdown files, and Google Sheets create a communication breakdown between data teams and developers. Glazed provides visual tracking documentation where every event is linked directly to the design element that triggers it—eliminating interpretation errors and implementation bugs before they happen.
AI-Powered Tracking Plan Creation from Figma Designs
Generate implementation-ready tracking code in minutes with AI that analyzes your Figma screens, suggests events matching your existing taxonomy, and creates prompts that work seamlessly with Cursor, Claude Code, Bolt, Lovable, or any AI coding assistant. Move from design to tracked features without the developer handoff bottleneck that slows product velocity.
Built for Multi-Platform Product Teams
Whether you're managing tracking for iOS, Android, Web, or all three platforms simultaneously, Glazed ensures cross-platform tracking consistency with a single visual source of truth. Data teams, product managers, and developers all reference the same Figma-linked specifications—no more platform-specific interpretations or inconsistent implementations.
Proven Results: Real Teams, Real Time Savings
Companies like Cafeyn with 10 developers across multiple platforms have eliminated tracking alignment meetings entirely, reduced tracking bugs by 50%, and saved 100+ hours per month—capacity that's freed up for building features that drive business value instead of fixing preventable tracking implementation errors.
The Modern Alternative to Tracking Spreadsheets
Move beyond Excel tracking templates, Google Sheets specs, and GitHub markdown files. Glazed offers visual tracking collaboration that scales with your team—from startups to enterprises with 20+ developers. Works with your existing analytics stack including Segment, Amplitude, Mixpanel, and any product analytics platform.
Key Benefits of Visual Tracking Documentation
- Replace tracking spreadsheets with visual specs linked to Figma designs
- Eliminate weekly tracking alignment meetings and Slack back-and-forth
- Reduce tracking implementation bugs by 50% with visual context
- Save hundreds of hours per sprint across iOS, Android, and Web teams
- Ensure cross-platform tracking consistency automatically
- Enable self-service tracking documentation for product teams
- Generate AI-powered tracking code for faster implementation
- Integrate seamlessly with Amplitude, Mixpanel, and Segment
Stop Losing Time to Tracking Coordination Chaos
Every tracking alignment meeting is time your developers aren't building features. Every implementation bug from ambiguous specs is half a day lost to debugging. Every Slack thread asking "which button should trigger this event?" is friction that visual tracking documentation eliminates entirely. Try Glazed free or book a demo to see how visual tracking plans transform your development workflow.
Turn Figma designs into tracking plans
Create and ship your analytics events 10x faster with AI.
Eliminate alignment meetings
and cut bugs in half.
Trusted by teams at
AI-Powered Tracking Plan Creation: Generate Events from Figma Designs in Minutes
Stop manually creating tracking events in spreadsheets. Glazed AI analyzes your Figma designs and automatically suggests relevant tracking events based on your existing taxonomy—delivering tracking plans 10x faster than traditional methods. Our AI learns from your current Amplitude, Mixpanel, or PostHog events to maintain consistency while eliminating the manual documentation burden that slows product velocity.
Intelligent Event Suggestions That Match Your Tracking Taxonomy
Unlike generic tracking tools, Glazed AI learns your specific event naming conventions, property structures, and taxonomy patterns. When analyzing new Figma screens, it suggests events that seamlessly integrate with your existing tracking plan—preventing the data inconsistency issues that plague teams using tracking spreadsheets or manual documentation methods.
How AI Event Discovery Works
Upload your Figma design file into Glazed. Our AI analyzes every screen, button, form, and interaction element while referencing your existing event taxonomy from Amplitude or Mixpanel. Within minutes, receive a complete tracking plan with suggested event names, properties, and implementation notes—all formatted to match your team's established patterns. Review suggestions, make adjustments, then generate AI assistant prompts that translate directly into production code. The entire process that once took days of coordination meetings and spreadsheet updates now happens in a single session.
Stop Losing Time to Manual Tracking Documentation
Every hour spent manually documenting events in tracking spreadsheets is time not spent analyzing data or building features. Every missed event because specs were unclear is a gap in your analytics. Every developer handoff meeting to explain tracking requirements is friction. Glazed AI eliminates this coordination tax by automating event creation while maintaining the quality and consistency your analytics stack demands.
AI-powered
event creation
AI-powered
event creation
GlazedAI analyses your Figma designs, learns your existing events, and suggests relevant tracking with proper taxonomy.
Teams report 10x faster tracking plan creation
Key AI Event Creation Features
- AI analyzes Figma designs and learns your existing event taxonomy from Amplitude, Mixpanel, PostHog or a custom CSV.
- Approve, edit, or reject AI event recommendations with full control over final tracking plan
- Create complete tracking plans in minutes instead of days of manual spreadsheet work
- Eliminate tracking coordination meetings and developer handoff delays entirely
- Direct integration with Amplitude, Mixpanel, PostHog, and Segment for seamless schema imports
- Automatic cross-platform consistency for iOS, Android, and Web implementations
- Replace error-prone tracking spreadsheets with AI-powered automation
- Self-service tracking creation enables product teams to ship faster independently
- Generate implementation-ready prompts for Cursor, Claude Code, Bolt, Lovable, and any AI coding assistant
- Maintain taxonomy standards automatically without manual quality checks
AI vs Manual Tracking Documentation
Traditional tracking spreadsheet workflows require data teams to manually analyze designs, write event specifications, coordinate with developers, and maintain version control across multiple documents. This process typically takes 2-5 days per feature and creates coordination bottlenecks that delay product launches. Glazed AI completes the same workflow in minutes: automatic design analysis, intelligent event suggestions based on your taxonomy, and instant generation of implementation-ready code prompts. The result is 10x faster tracking plan creation with higher accuracy and zero coordination meetings.
Figma Plugin for Visual Tracking Handoffs: Replace CSV Files with In-Canvas Specs
Stop forcing developers to decode tracking spreadsheets with hundreds or thousands of rows. Our Figma plugin delivers exact tracking specifications directly within your design files—where developers already review UI requirements. See precise element IDs, event names, property definitions, and implementation details without leaving the Figma canvas. Perfect for teams who prefer developer-led implementation but want to eliminate the coordination meetings, Slack back-and-forth, and specification confusion that plague traditional tracking handoff processes.
Visual Tracking Documentation That Lives Where Developers Work
Your development team already spends hours in Figma reviewing designs, identifying UI elements, and planning implementations. Why force them to context-switch to a separate tracking spreadsheet, CSV file, or GitHub markdown document? Glazed's Figma plugin embeds tracking specifications directly on the design canvas—linking each event to the exact button, form, or interaction element it tracks. Developers click on a UI component and instantly see what tracking code to implement. No interpretation required. No "which button did they mean?" confusion. Just clear, visual specifications that eliminate implementation errors before they happen.
Why Visual Tracking Handoffs Beat Traditional Methods
Tracking spreadsheets with hundreds of rows: developers spend as much time searching for the right spec as implementing it, leading to frequent "I can't find this event" Slack messages. CSV file exports: no visual context means constant back-and-forth to confirm "is this the button you meant?" resulting in implementation delays. Glazed Figma plugin: click on any design element, see its exact tracking specification instantly. The visual link between UI and tracking requirements eliminates every source of confusion that causes coordination meetings and implementation bugs.
Developer
handoffs in Figma
Developer
handoffs in Figma
See exactly what to track: UI triggers, event names, and expected property values. Eliminate confusion and back-and-forths with our Figma plugin.
Teams report 90% fewer alignment meetings
- Visual tracking specifications embedded directly on Figma design canvas—no separate CSV files or spreadsheets
- Click any screen or UI element to see exact tracking requirements without context-switching
- Replace hundreds of spreadsheet rows with clear visual documentation developers actually use
- Precise element IDs, event names, property definitions visible on design components
- Eliminate "which button?" confusion with visual linking between specs and UI elements
- Developer-ready implementation details: element selectors, data types, conditional logic, platform notes
- 90% fewer tracking alignment meetings when developers access specs in Figma workflow
- Auto-sync between Glazed platform and Figma plugin for seamless team collaboration
- Install from Figma Community in seconds
- Support for iOS, Android, Web implementations with platform-specific guidance
- 50% faster implementation vs decoding tracking spreadsheet CSV exports
- 50% fewer implementation bugs when developers have visual context vs text specs
- Works alongside AI workflow or as standalone developer-led implementation tool
- Integrates naturally with existing Figma design review and handoff processes
- No forced context-switching between design files and separate documentation tools
- Prevent coordination chaos by documenting tracking where developers already work
How Figma Plugin Handoffs Work
Data or product teams create tracking plans in Glazed, linking events to specific Figma design elements. Specifications automatically sync to the Figma plugin, embedding tracking details directly on the design canvas. When developers review designs (as they normally do), they simply click on any figma frame to view complete tracking specifications for that screen: event names following your taxonomy, required properties with data types and expected values. Developers implement tracking with full visual context, eliminating the interpretation errors and coordination meetings that slow traditional tracking workflows. The entire process happens within Figma—no CSV exports to download, no spreadsheet rows to search through, no Slack threads to decode ambiguous specs.
Replace Scattered Tracking Spreadsheets with Cross-Platform Single Source of Truth
Stop the chaos of scattered tracking spreadsheets, duplicate Google Docs, outdated Confluence pages, and endless "what does this event do?" Slack threads. Glazed creates a unified tracking repository where iOS, Android, Web, Product, and Data teams all reference the same visual specifications. Perfect for multi-platform teams tired of tracking inconsistency issues, documentation drift, and the coordination overhead that delays feature launches. When everyone works from a single source of truth integrated with Figma designs, cross-platform tracking consistency happens automatically—no more platform-specific interpretations of ambiguous text specs.
Stop Platform Teams from Implementing Different Versions of the Same Event
The biggest cause of broken cross-platform analytics isn't bad developers—it's fragmented documentation. Your iOS team maintains tracking specs in their own spreadsheet, Android references a separate Google Doc, Web uses GitHub markdown files, and the data team has a "master" sheet nobody keeps updated. Each documentation source slowly diverges. When implementing the same user action, iOS creates "add_to_cart", Android implements "AddToCart", and Web tracks "cart_item_added"—three different event names for identical behavior. Suddenly your cross-platform funnels in Amplitude or Mixpanel are impossible to build because events don't match across platforms. Glazed eliminates this fragmentation by treating events like reusable code components: define once in a unified repository, and iOS, Android, Web all implement from the same canonical specification. No room for platform-specific variations. No interpretation errors. Just consistent tracking that makes cross-platform analytics actually work.
Single Event Repository Prevents Taxonomy Chaos and Duplicate Definitions
Without a centralized tracking repository, teams accidentally create duplicate events for the same user actions. One PM defines "User Signup" for their feature. Another creates "Sign Up Complete" for a different flow. A third implements "Registration Finished" in the mobile app. Your analytics now has three separate events tracking identical behavior—making user journey analysis impossible and stakeholder trust in metrics nonexistent. Glazed's project namespace system organizes events into a single, searchable repository that teams reference before creating new tracking. Building a checkout flow? Search the repository and discover you already have a "Checkout Started" event. Our AI actively suggests reusing existing events rather than creating taxonomy-breaking duplicates. Product managers get self-service tracking creation with built-in guardrails that maintain data quality. The result: a clean analytics taxonomy that grows thoughtfully instead of spiraling into unmaintainable spreadsheet chaos with hundreds of redundant event definitions.
Visual Specifications Everyone Understands—From Engineers to Stakeholders
Text-based tracking spreadsheets only work for technical teams comfortable parsing rows of event names, property definitions, and implementation notes. Product managers struggle to discover what's already tracked. Designers can't verify their features have analytics coverage. Marketing teams ping data analysts with "what event shows newsletter signups?" requests. Glazed's visual approach makes tracking documentation accessible to everyone: specifications linked directly to Figma design components show exactly what gets tracked and why. Non-technical team members browse visual tracking plans to understand analytics coverage. Product managers see which user actions have events without learning analytics jargon. Cross-functional teams align on tracking strategy by reviewing visual specs together rather than decoding spreadsheet rows in isolation. When tracking documentation is visual, collaboration improves, duplicate implementations decrease, and "what does this event do?" Slack messages disappear—because everyone, regardless of technical background, can understand your tracking at a glance.
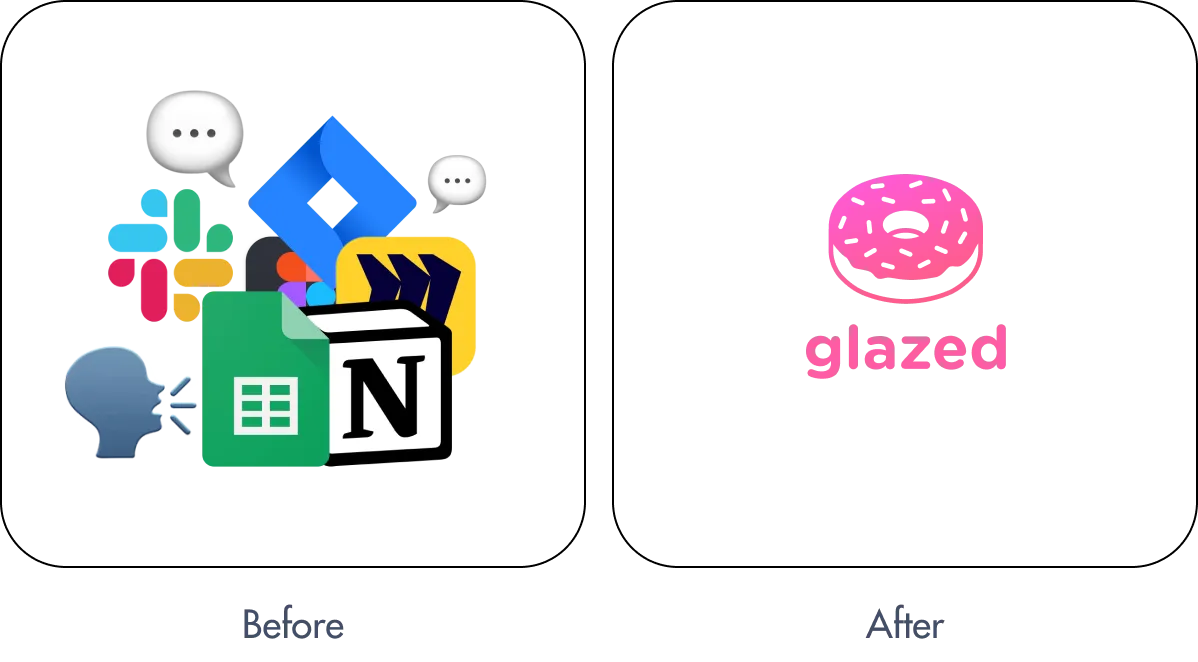
From Documentation Chaos to Unified Standards
The before state: iOS maintains tracking specs in Excel. Android uses Google Sheets. Web references Notion docs that haven't been updated in months. Data team has a Confluence page nobody reads. Product managers ping Slack asking where to find tracking information. Result: scattered documentation across five tools, constant "where's the spec?" questions, platform implementations that don't align, broken cross-platform analytics, and teams spending more time coordinating than building. The after state with Glazed: one visual tracking repository integrated with Figma where every team finds specifications. iOS, Android, Web implement from identical event definitions. Product managers browse tracking plans visually without data team dependency. AI suggests reusing existing events to maintain taxonomy. Updates sync in real-time across all teams. Result: 50% fewer tracking bugs, zero coordination meetings, cross-platform consistency by default, and teams that ship tracked features without the documentation chaos that previously delayed every launch.
Cross-platform
consistency
Cross-platform
consistency
Replace scattered spreadsheets, docs, and Slack pings with visual tracking specs everyone understands. iOS, Android, Web, Product, and Data teams all reference the same events.
At least 50% less tracking bugs guaranteed
- Replace scattered tracking spreadsheets, Google Docs, Confluence, and Notion tables with unified repository
- Avoid duplicated events due to lack of centralized source of truth
- Single source of truth for iOS, Android, Web, Product, and Data teams eliminates documentation drift
- Cross-platform tracking consistency: define events once, implement identically across all platforms
- Visual tracking documentation integrated with Figma designs everyone can understand
- Eliminate "what does this event track?" Slack threads and coordination meetings
- Event repository prevents duplicate definitions like "User Signup", "Sign Up Complete", "Registration Finished"
- AI suggests reusing existing events to maintain clean analytics taxonomy
- 50% fewer tracking bugs from unified specifications vs scattered platform documentation
- Non-technical team members discover tracking coverage without data team dependency
- Real-time sync ensures all teams see identical specifications across iOS, Android, Web
- Project namespaces organize events into centralized, searchable repositories
- Cross-platform funnels in Amplitude and Mixpanel work correctly without manual event mapping
- Visual specifications accessible to engineers, PMs, designers, and stakeholders
- Stop manual maintenance of tracking documentation across multiple tools and platforms
Why Teams Switch from Scattered Spreadsheets to Glazed
Teams using scattered tracking documentation face constant friction: developers can't find specs, product managers don't know what's already tracked and create duplicates, platform teams implement different versions of the same events, cross-platform analytics breaks because event names don't match, documentation drifts out of sync across iOS/Android/Web, and coordination meetings consume hours that should be spent building features. Glazed eliminates this chaos with a single tracking repository that integrates with Figma where teams already work. Visual specifications make tracking understandable to non-technical team members. Event reuse prevents taxonomy sprawl. Cross-platform consistency happens by default when everyone implements from unified definitions.
Component-Level Tracking Specs: Define Exact Property Values on Design Elements
Stop the "which value?" questions that generate endless Slack threads between data teams and developers. With Glazed, you define exact property values, custom variables, and expected data directly on Figma design components—not in separate tracking spreadsheets developers have to cross-reference. Specify that a button should send category="electronics" or product_id="SKU-12345" right on the design element itself. Developers see crystal-clear implementation requirements without interpretation, reducing back-and-forth by 90% and eliminating the ambiguity that causes tracking bugs. An image is worth 1,000 words—especially for tracking documentation.
Eliminate "Which Value Should I Send?" Developer Questions
Traditional tracking spreadsheets define events generically: "Track Product Viewed with properties: product_id, category, price." Sounds clear until developers ask: "What format for product_id? Do you want 'electronics' or 'Electronics' for category? Should price include currency symbol?" Each question spawns Slack threads, delays implementation, and risks incorrect tracking if developers guess wrong. Glazed's component-level approach eliminates guesswork by letting you specify exact expected values directly on design elements. Click on a product card in Figma, define that THIS instance should send category="home_goods" (lowercase, underscore-separated), product_id using the SKU format "PROD-(id)", and price as a number without currency symbols. Developers implementing that specific button see precise requirements—no interpretation needed, no questions generated, no bugs from ambiguous specs. When documentation is this granular, back-and-forth conversations disappear because every implementation detail is crystal clear.
Customize Event Instances Without Breaking Canonical Definitions
Your "Add to Cart" event has a standard definition with required properties. But different product categories need variations: electronics require warranty_selected, clothing needs size and color, digital products want license_type. Traditional tracking documentation handles this poorly—either you create separate events (fragmenting your taxonomy) or add conditional notes to spreadsheets that developers miss. Glazed lets you maintain canonical event definitions while customizing instances at the component level. Your "Add to Cart" event stays unified across the product, but you can specify on the electronics page that THIS add-to-cart button also captures warranty data, while the clothing page instance includes size/color properties. Developers see context-specific requirements for each implementation without hunting through spreadsheet footnotes. Your analytics taxonomy stays clean with a single "Add to Cart" event, yet captures the granular context each product category requires. This instance-level customization with design-element precision is impossible in text-based tracking spreadsheets.
Annotations, Tags, and Metadata at Maximum Granularity
Beyond property values, teams need to document implementation context: "This event only fires for logged-in users," "Track on button click, not page load," "Required for Q2 revenue dashboard," or "Deprecated—use new_checkout_flow instead." Tracking spreadsheets bury these details in notes columns developers scroll past. Glazed embeds annotations, tags, and metadata directly on design components at the exact implementation point. Tag events by priority (P0/P1/P2), feature area (checkout/onboarding/profile), or analytics use case (conversion funnel/retention analysis). Add implementation notes that appear when developers click the component. Flag deprecated tracking that should be removed. This design-element-level granularity ensures critical context reaches developers exactly when needed—not hidden in a separate documentation tab they'll never read. The result: fewer implementation mistakes, less time clarifying requirements, and tracking that actually matches what your analytics dashboards expect.
Define tracking at
component level
Define tracking at
component level
Stop the "which value?" questions. Define exact property values and custom variables directly on design components. Specify exactly what to send.
An image is worth 1.000 words
Component-Level Specification Features
- Define exact property values directly on Figma design components, not separate spreadsheets
- Specify custom variables and expected data types at design-element level
- Eliminate "which value should I send?" developer questions that delay implementation
- Customize event instances while maintaining canonical definitions for taxonomy consistency
- Component-level annotations, tags, and metadata visible at exact implementation point
- 90% reduction in back-and-forth Slack threads about ambiguous tracking requirements
- Crystal-clear implementation specs prevent interpretation errors and tracking bugs
- Flag deprecated tracking or conditional logic requirements at component level
- Specify data formats: "electronics" vs "Electronics", number vs string, date formats
- Context-specific requirements for different product categories or user states
- Visual documentation developers can't miss—embedded where they review designs
- Maximum granularity impossible with text-based tracking spreadsheet documentation
Why Component-Level Specs Beat Spreadsheet Notes
Traditional tracking spreadsheets define events generically with property lists, burying critical details in notes columns: "category should be lowercase with underscores," "price excludes currency," "only fire for logged-in users." Developers implementing features rarely scroll to read these notes, leading to constant "which format?" questions via Slack and implementation bugs from incorrect assumptions. Glazed's component-level approach embeds every specification detail directly on the design element: exact expected values, data type requirements, conditional logic, custom variables, and implementation context—all visible when developers click the button or form they're building. This design-element precision eliminates the interpretation layer that generates back-and-forth conversations, reduces tracking bugs by 50%, and ensures developers implement correctly the first time because requirements are crystal clear at the exact point of implementation. An image with embedded specs truly is worth 1,000 words of spreadsheet documentation.
Self-Service Tracking Implementation: AI Prompts for Cursor, Claude Code, Codex, Bolt, and Lovable
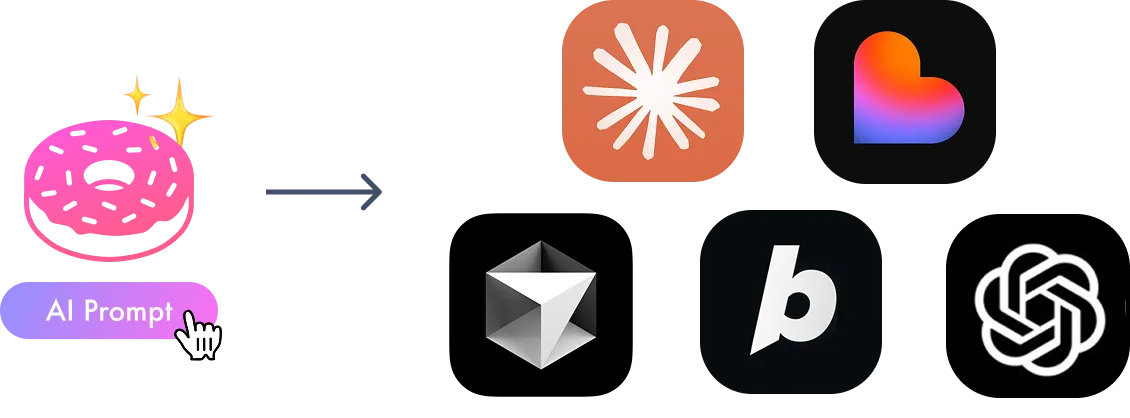
Enable product teams and designers to implement tracking independently without developer bottlenecks. Glazed generates implementation-ready prompts from your Figma designs that work seamlessly with Cursor, Claude Code, Codex, Bolt, Lovable, Replit, and any AI coding assistant. Perfect for fast-moving startups where developers focus on high-impact features while product managers and designers ship tracked experiences using AI assistants. Copy the prompt, paste into your coding tool, let AI generate production-ready tracking code, and have developers review the PR—eliminating weeks of engineering ticket backlogs and coordination delays.
Eliminate Developer Handoff Bottlenecks for Client-Side Tracking
At fast-moving startups, waiting for developer availability to implement tracking creates launch delays. Your designer finishes a new onboarding flow, but shipping tracked features requires an engineering ticket, sprint planning, and coordination meetings—adding 1-2 weeks before analytics coverage exists. Glazed's AI prompt workflow eliminates this bottleneck for client-side tracking: import your Figma file, let AI suggest relevant events based on your existing taxonomy, generate an implementation prompt with exact event names, property definitions, and element selectors, then paste into Cursor or Claude Code to instantly create tracking code. Product managers and designers ship tracked features independently in minutes while developers focus on building core product functionality. A developer still reviews the PR for quality assurance, but the implementation work happens without consuming engineering bandwidth. This self-service approach works exceptionally well for client-side UI tracking (button clicks, form submissions, page views) where AI coding assistants excel at generating accurate event instrumentation.
Fast-Moving Teams Choose Speed Over Traditional Developer Ownership
Larger enterprises with dedicated data engineering teams prefer developer-led tracking implementation for control and quality. But early-stage startups and agile product teams optimize for velocity: designers and PMs are expected to use AI coding assistants like Claude Code and Cursor for straightforward implementation work, freeing senior developers to tackle complex architecture challenges. This shift in ownership is increasingly common at US startups where non-engineers leverage AI tools to ship features faster. Glazed's AI prompt workflow fits this modern team structure perfectly: product teams define what to track using visual Figma specifications, Glazed generates prompts optimized for AI assistants, non-technical team members paste prompts into Cursor/Claude Code/Bolt, AI generates implementation-ready tracking code in minutes, and developers review PRs rather than writing code from scratch. The result: tracked features ship 10x faster because implementation doesn't wait in engineering backlogs, product teams take ownership of analytics coverage, and developers contribute expertise through code review rather than manual implementation.
Implement
tracking with AI
Implement
tracking with AI
Generate implementation prompts that work with your favourite AI assistant. Copy, paste, and ship tracked features without developer bottlenecks.
Ship tracking code in minutes with self-service
AI Prompt Implementation Features
- Generate implementation-ready tracking prompts from Figma designs in one click
- Compatible with Cursor, Claude Code, Codex, Bolt, Lovable, Replit, and any AI coding assistant
- Self-service tracking implementation for product managers and designers without coding
- Eliminate developer handoff bottlenecks and 1-2 week engineering ticket delays
- AI suggests events from existing taxonomy to prevent duplicate tracking definitions
- Production-ready tracking code generation optimized for AI assistant capabilities
- Ship tracked features in minutes instead of waiting weeks for developer availability
- Perfect for client-side UI tracking: button clicks, forms, navigation, page views
- Developer PR review maintains quality while eliminating implementation bottleneck
- Enable fast-moving startup teams to ship analytics without consuming engineering bandwidth
- Copy-paste workflow: Glazed prompt → AI assistant → tracked feature deployed
- 10x faster implementation vs traditional engineering ticket workflows
- Best for early-stage startups and agile teams optimizing for velocity
Self-Service Tracking Workflow
Modern fast-moving startups empower product teams with AI coding assistants to ship features independently: (1) Designer completes new feature screens in Figma. (2) Import Figma file into Glazed—AI analyzes designs and suggests relevant tracking events. (3) Review AI suggestions, approve events, customize property values at component level. (4) Click "Generate Prompt" to create implementation instructions optimized for AI assistants. (5) Copy prompt, paste into Cursor, Claude Code, Bolt, or Lovable—AI generates tracking code in seconds. (6) Product manager or designer commits code, creates PR for developer review. (7) Developer reviews tracking implementation for quality (5 minutes vs 2 hours implementing from scratch). (8) Merge and deploy—tracked feature ships without waiting in engineering backlogs. This workflow transforms tracking from a developer dependency into a product team capability, enabling 10x faster implementation while maintaining quality through developer code review. Perfect for client-side tracking where AI assistants excel at generating accurate instrumentation code.
When to Use AI Self-Service vs Developer-Led Implementation
Choose AI self-service tracking when: you're an early-stage startup with limited developer bandwidth, your team needs to ship tracked features quickly without engineering ticket delays, you're implementing client-side UI tracking (buttons, forms, navigation), product managers or designers are comfortable using AI coding assistants like Cursor or Claude Code, and developers can review PRs faster than implementing from scratch. Choose developer-led implementation when: you're a larger team with dedicated data engineering resources, you need server-side tracking for backend API calls or database transactions, you require strict quality control across all tracking implementations, your organization prefers centralized developer ownership of analytics code, or you're implementing complex tracking logic that requires deep system knowledge. Glazed supports both workflows: generate AI prompts for self-service velocity or use Figma plugin specs for traditional developer handoffs. Many teams use a hybrid approach—self-service for client-side tracking that needs speed, developer-led for server-side events requiring expertise.
From Zero to Tracked Features in 10 Minutes: Fast Setup for Any Team Size
Stop spending weeks setting up tracking infrastructure. Glazed's streamlined workflow takes you from empty tracking plan to production-ready implementation in under 10 minutes—regardless of whether you have a dedicated development team or use AI coding assistants. Import your Figma design file, optionally upload your existing tracking schema from Amplitude, Mixpanel, or PostHog, let AI analyze screens and recommend relevant events, then choose your path: handover visual specs to developers via Figma plugin or generate implementation prompts for Cursor, Claude Code, Bolt, Lovable, and any AI assistant. No complex onboarding, no engineering sprints to configure tools, no workflow disruption. Just fast, flexible tracking setup that adapts to how your team actually works.
Two Implementation Paths: Developer-Led or Self-Service with AI Assistants
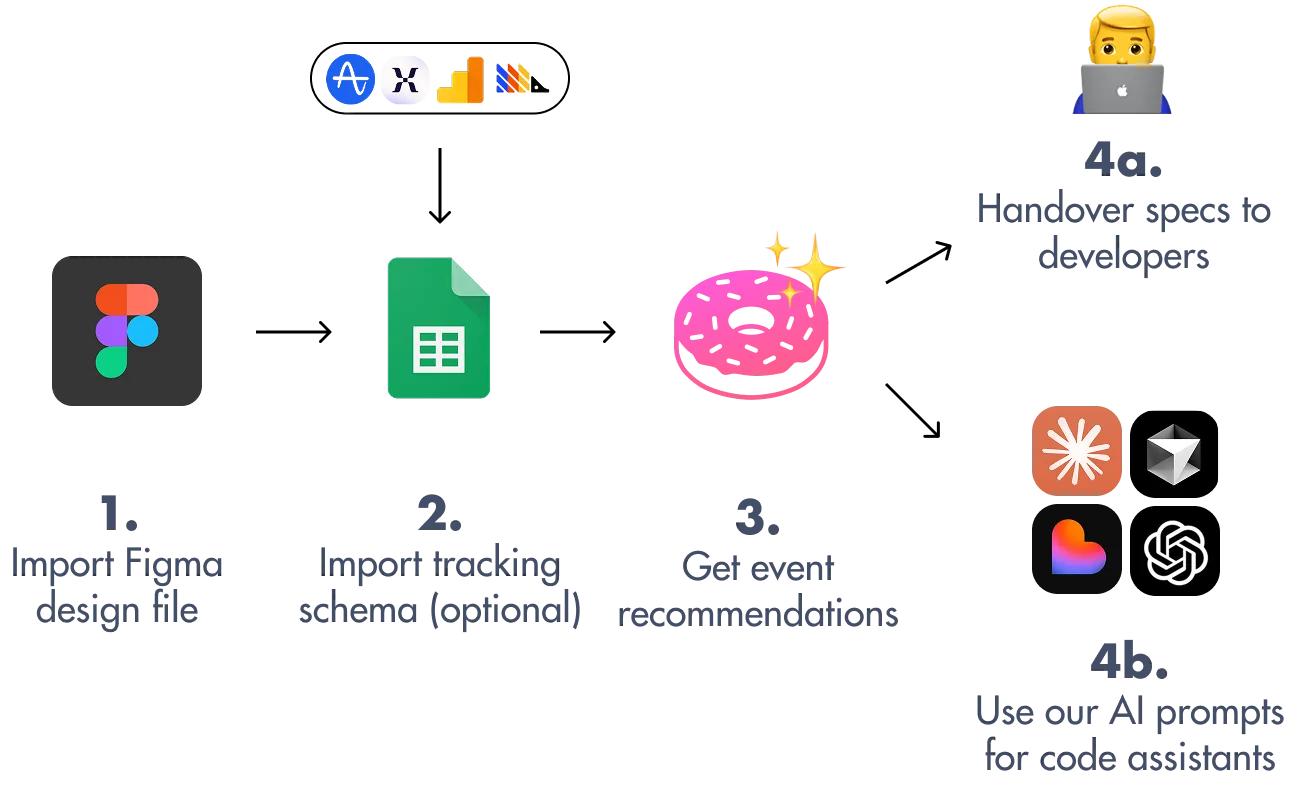
Glazed supports how teams of every size ship tracking. **Path 4a - Developer-led implementation:** Perfect for established teams with dedicated developers. Import Figma file → Get AI event recommendations → Review and customize events → Developers access specs via Figma plugin → Ship tracked features with full developer ownership. This path works for any team size and handles both client-side and server-side tracking, with developers implementing from crystal-clear visual specifications that eliminate ambiguity. **Path 4b - Self-service with AI coding assistants:** Ideal for fast-moving startups optimizing for velocity. Import Figma file → Get AI event recommendations → Generate implementation prompts → Copy into Cursor, Claude Code, Bolt, or Lovable → AI generates tracking code → Developer reviews PR. This path enables product managers and designers to ship client-side tracking independently while developers focus on high-impact features. Both workflows start with the same 10-minute setup—you choose your implementation approach based on team structure and velocity needs.
Import Existing Tracking Schema for Smarter AI Recommendations
Already tracking events in Amplitude, Mixpanel, PostHog, or Segment? Import your existing tracking schema so Glazed AI learns your established event taxonomy, property naming conventions, and analytics patterns. When analyzing new Figma designs, AI will prioritize suggesting events you already use rather than creating taxonomy-breaking duplicates. For example, if your schema shows "Purchase Completed" as the checkout event, AI won't suggest creating "Checkout Finished" or "Order Complete" for new features—it recommends reusing your existing event for consistency. This schema import is optional (you can start from scratch if beginning analytics), but existing tracking infrastructure makes AI recommendations dramatically smarter by preventing the event proliferation that plagues teams using manual tracking spreadsheet approaches. Connect once, get intelligent suggestions forever as you add new features.
Ship in minutes,
not months
Ship in minutes,
not months
Import your Figma file, get AI event recommendations and handover the specs to the tech team or use our implementation prompts with your preferred coding assistant.
From zero to tracking in 10 minutes
Fast Setup & Implementation Workflow
- From zero to production tracking in 10 minutes, not weeks of engineering setup
- Step 1: Import Figma design files
- Step 2 (optional): Upload existing tracking schema from Amplitude, Mixpanel, PostHog, Segment or a custom CSV
- Step 3: Get AI event recommendations that learn your taxonomy and suggest relevant events
- Path 4a: Handover visual specs to developers via Figma plugin for traditional implementation
- Path 4b: Generate AI prompts for Cursor, Claude Code, Bolt, Lovable - self-service tracking
- Works for teams of any size: established companies with dev teams or fast-moving startups
- No complex onboarding, configuration sprints, or workflow disruption required
- Developer-led path handles more complex tracking implementations
- AI assistant path perfect for client-side UI tracking with product team ownership
- Schema import makes AI suggestions 10x smarter by preventing duplicate event creation
- Native integration with Amplitude, Mixpanel, PostHog tracking infrastructure
Why Setup Speed Matters for Product Velocity
Traditional tracking tool setup consumes weeks: engineers configure SDKs, data teams define event schemas, product managers wait for infrastructure completion before shipping tracked features. This front-loaded setup delays analytics coverage for every new feature launch. Glazed eliminates setup overhead with a 10-minute workflow that gets teams tracking immediately: import Figma designs you already have, optionally connect existing tracking schemas (Amplitude, Mixpanel, PostHog), let AI analyze and suggest events in seconds, then choose your implementation path—developer handoff via Figma plugin or self-service with AI coding assistants. No engineering sprints. No complex configurations. No workflow changes. Just fast tracking setup that adapts to team structure: established companies with dedicated developers use Path 4a for full developer ownership; fast-moving startups use Path 4b to enable product managers and designers to ship tracking independently. Both paths start with the same efficient 10-minute setup, proving you don't need complex infrastructure to get production-quality tracking coverage.
Import Existing Schema for Maximum AI Intelligence
Teams already using Amplitude, Mixpanel, PostHog, or Segment can supercharge AI recommendations by importing existing tracking schemas. Upload your current event definitions, property structures, and taxonomy once—Glazed AI learns your established patterns and prioritizes suggesting existing events when analyzing new Figma designs. This prevents the taxonomy proliferation that plagues manual tracking spreadsheet approaches where each new feature introduces slightly different event names for identical user actions. For example, if your schema defines "Video Played" for media tracking, AI won't suggest creating "Video Started" or "Play Video" when you design a new video feature—it recommends reusing your existing event for cross-feature consistency. Teams starting from scratch can skip schema import and let Glazed create taxonomy from scratch as you build, but existing tracking infrastructure makes AI recommendations dramatically more accurate by grounding suggestions in your actual analytics patterns rather than generic best practices.
Glazed Analytics Pricing Plans
Flexible pricing options for teams of all sizes. From small product teams to enterprise-scale analytics implementations.
$29/month/editor ![]() | $6/month/viewer
| $6/month/viewer ![]() | Free Figma plugin viewers
| Free Figma plugin viewers ![]()
Starter
Includes 1 editor seat ![]()
- ✓300 linked events

- ✓1 project
- ✓Unlimited Figma plugin viewers
- ✓7-day free trial
- ✓No credit card required
Team
Includes 5 editor seats ![]()
- ✓2,000 linked events
- ✓3 projects
- ✓Unlimited Figma plugin viewers
- ✓7-day free trial
- ✓No credit card required
Growth
Unlimited editor and viewer seats
- ✓10,000 linked events
- ✓10 projects
- ✓DWH Connectors
- ✓Events and properties monitoring
- ✓Unlimited Figma plugin viewers
- ✓Dedicated support
Available Features
- Figma plugin integration
- Design file tracking
- Historical data access
- Multi-user collaboration
- Dedicated support
- Analytics implementation
Eliminate Tracking Coordination Chaos: Visual Documentation That Actually Works
We're building the tracking documentation platform that multi-platform product teams actually need. Teams like Cafeyn with 10+ developers across iOS, Android, and Web waste 50+ hours per sprint on tracking coordination meetings, decoding ambiguous spreadsheet specs, and fixing implementation bugs from unclear documentation. Glazed eliminates this chaos with visual tracking specifications linked directly to Figma designs—replacing text-based tracking spreadsheets that create interpretation errors with crystal-clear visual context that iOS, Android, Web, Product, and Data teams all understand instantly.
The Problem We're Solving: Tracking Documentation That Developers Can't Understand
Multi-platform teams face a daily nightmare: tracking spreadsheets trying to describe visual UI elements with text. "Track the checkout button" could mean six different buttons across iOS, Android, and Web implementations. Each platform team interprets specs differently, creating tracking inconsistency issues that break cross-platform analytics and waste developer time in endless "which button did you mean?" Slack threads. Traditional tracking documentation—Excel sheets, GitHub markdown files, Google Docs—forces developers to context-switch between design files and separate specifications, generating the coordination meetings, implementation bugs, and documentation drift that delays feature launches. This isn't a tool problem. It's a communication problem. Text-based specs cannot adequately describe visual interfaces.
Our Vision: Tracking Specifications Linked to the Designs Developers Already Review
Developers already spend hours in Figma reviewing UI designs and planning implementations. Why force them to context-switch to tracking spreadsheets, CSV exports, or GitHub markdown? Glazed embeds tracking specifications directly on design components—linking each event to the exact button, form, or interaction element it tracks. iOS, Android, and Web teams all reference the same visual source of truth, eliminating the interpretation layer that causes 50% of tracking bugs. When developers can see tracking requirements on the actual UI element in Figma, "which button?" questions disappear. Cross-platform consistency happens automatically because everyone implements from identical visual specifications. Coordination meetings vanish because visual context answers questions upfront. This is how tracking documentation should have worked from the beginning—visual, contextual, and integrated where developers already work.
Ship tracked features. Faster
We believe development teams shouldn't waste hundreds of hours per sprint on tracking coordination chaos.
By replacing ambiguous tracking spreadsheets with visual specifications linked to Figma designs, we eliminate the interpretation errors that cause tracking bugs and coordination meetings.
Our Vision:
Vision: Eliminate Tracking Coordination Chaos for Multi-Platform Teams
- Visual tracking documentation that replaces ambiguous text-based spreadsheets
- Eliminate 50+ hours per sprint wasted on tracking coordination meetings
- Cross-platform consistency for iOS, Android, Web teams with single source of truth
- Figma-integrated specifications where developers already review UI designs
- Reduce tracking implementation bugs by 50% with visual clarity
- Zero coordination meetings when visual context answers questions upfront
- AI-powered tracking plan creation 10x faster than manual spreadsheet methods
- Compatible with Amplitude, Mixpanel, PostHog, and Segment analytics stacks
- Prevent interpretation errors that break cross-platform analytics funnels
- Stop context-switching between design files and separate tracking documentation
Why Multi-Platform Teams Choose Glazed
Teams with developers across iOS, Android, and Web platforms face unique tracking challenges: each platform team interprets text-based spreadsheet specs differently, creating tracking inconsistency issues that break cross-platform analytics; coordination meetings consume 50+ hours per sprint just to align on what gets tracked and how; implementation bugs from ambiguous specs waste half a day per fix across multiple platforms; and documentation drift between platform-specific tracking sheets erodes data quality over time. Glazed solves these multi-platform problems with visual tracking specifications that work as a single source of truth: iOS, Android, and Web developers all see identical specifications linked to the same Figma design components; visual context eliminates interpretation errors that cause tracking bugs; cross-platform consistency happens automatically when everyone implements from the same visual specs; and coordination meetings disappear because developers get answers from visual documentation instead of Slack threads. Companies like Cafeyn with 10+ developers report eliminating tracking meetings entirely, reducing bugs by 50%, and saving 100 hours per month after replacing tracking spreadsheets with Glazed's visual approach.